Blank psychrometric charts to download and print (PDF, SVG)
Blank psychrometric charts in the Carrier and Mollier conventions are free to download here, with no sign-up, as vector PDF (letter-friendly A4, A3), SVG or DXF — in I-P and SI units and for sea level as well as 5,000 ft.
Thirteen ready-made sheets in I-P and SI, at sea level and at altitude, drawn to the ASHRAE convention and to the central-European one. Vector PDF and SVG. Free, no sign-up, nothing stamped across the drawing.
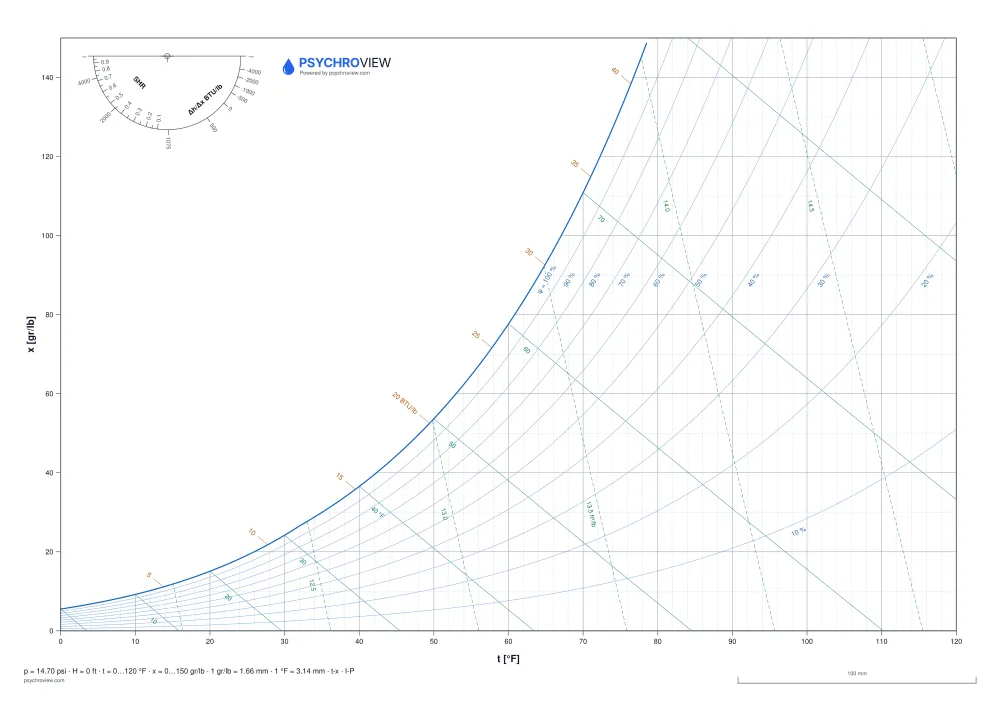
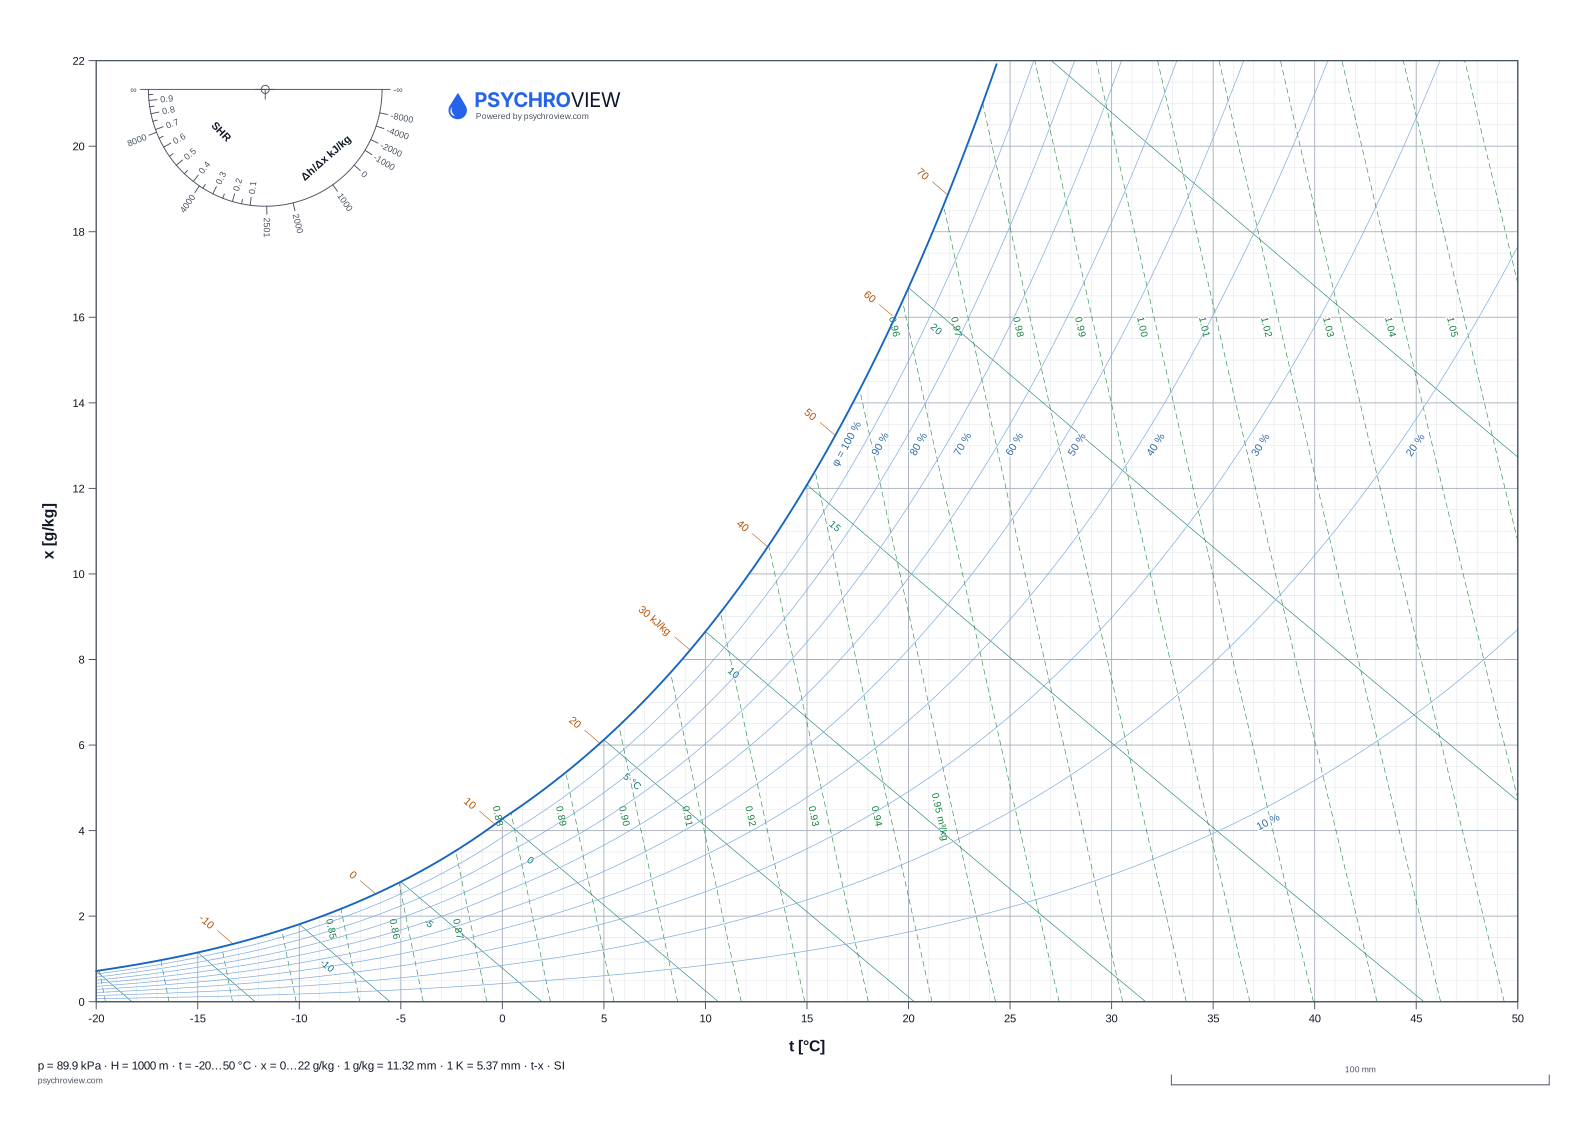
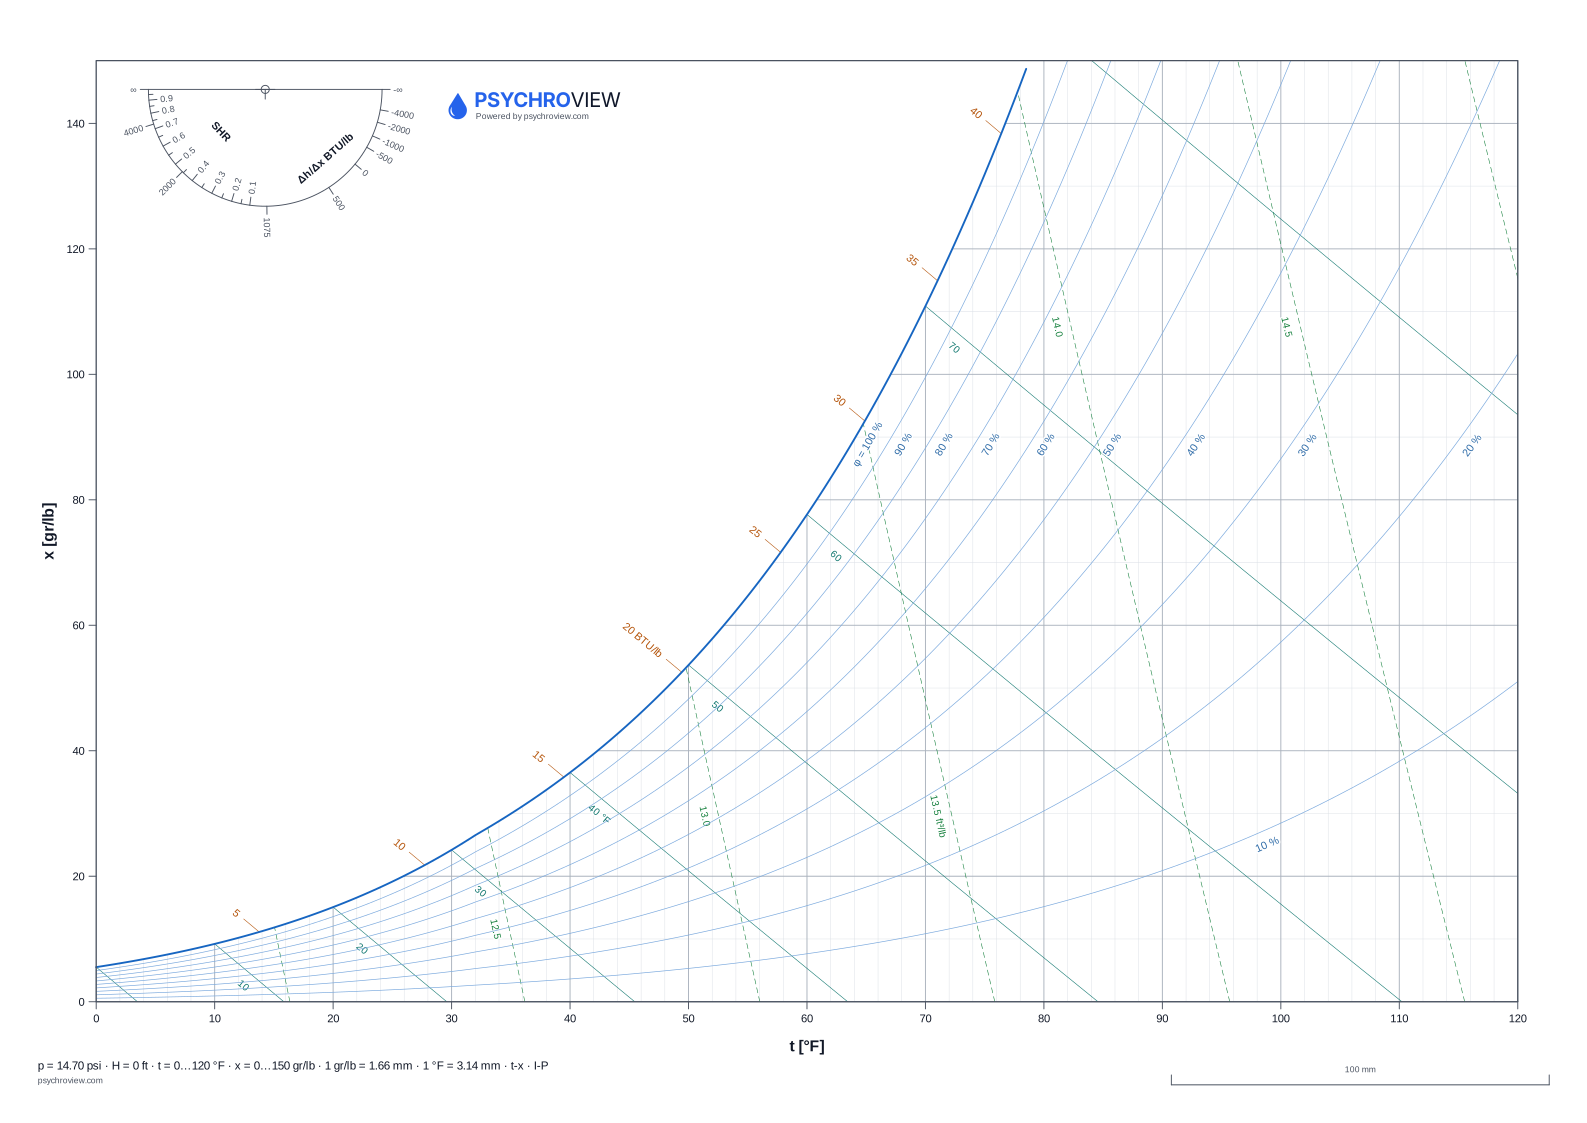
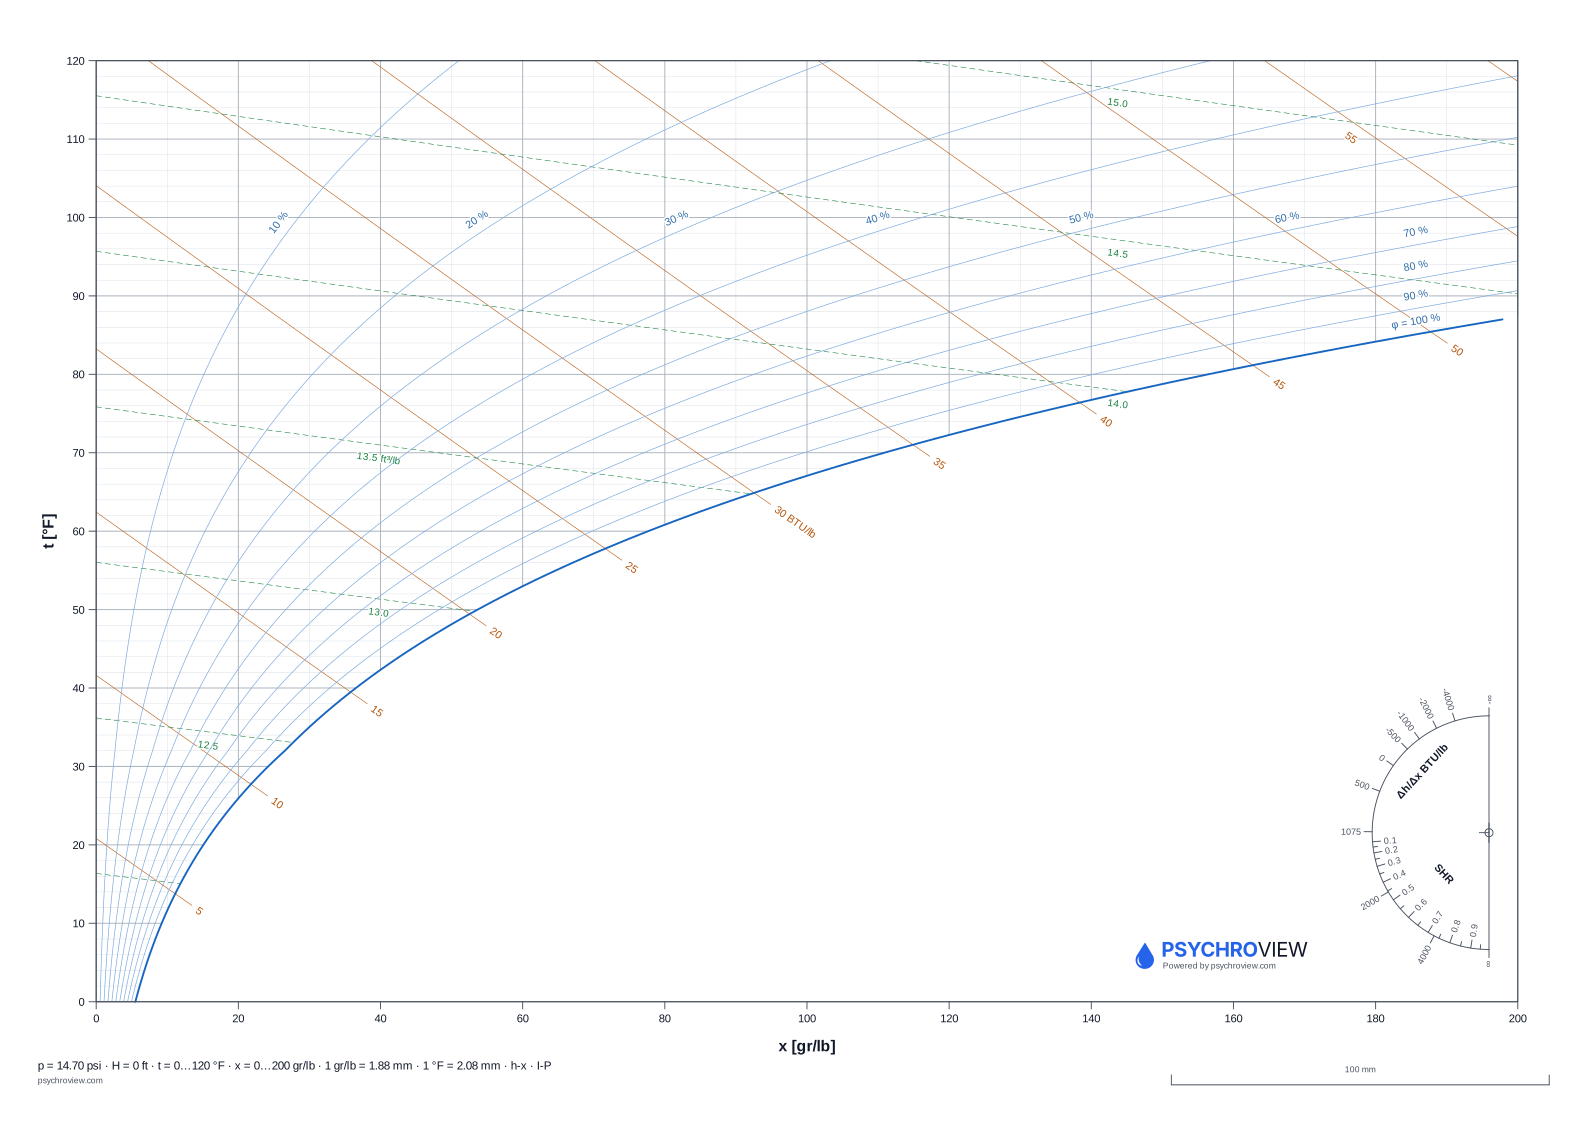
Every sheet is drawn by the same calculation core as the application — saturation pressure from the Hyland-Wexler equations, enthalpy and humidity ratio per ASHRAE Handbook — Fundamentals 2021. The I-P sheets carry the 0 °F enthalpy datum ASHRAE defines, not the 0 °C datum of the SI sheets.
The drawing itself carries no words, only symbols and units, so a single file serves every language. Line weights are absolute in millimeters (0.13 mm minor grid, 0.5 mm saturation line) and the sheet knows its own physical size, so the scale in the footer stays honest at any format.
Draw your own chart
Set the boundary conditions, the paper and what the sheet should carry. The preview is the same drawing that comes out of the download — nothing is rendered twice.
p = 101.3 kPa · t -20…50 °C · x 0…30 g/kg · A3 landscape
Download
The generator draws the grid. Points and processes are drawn into it by the application, which exports the same formats — PDF, DXF or PNG.
This one is already prepared
The same sheet is in the ready-made set, so you can take it straight from the server — a stable link you can share, and no waiting for the browser.
Which sheet do you need
| Decision | I-P | SI |
|---|---|---|
| Units | °F, gr/lb, Btu/lb — US practice, ASHRAE | °C, g/kg, kJ/kg — European practice, EN and ISO |
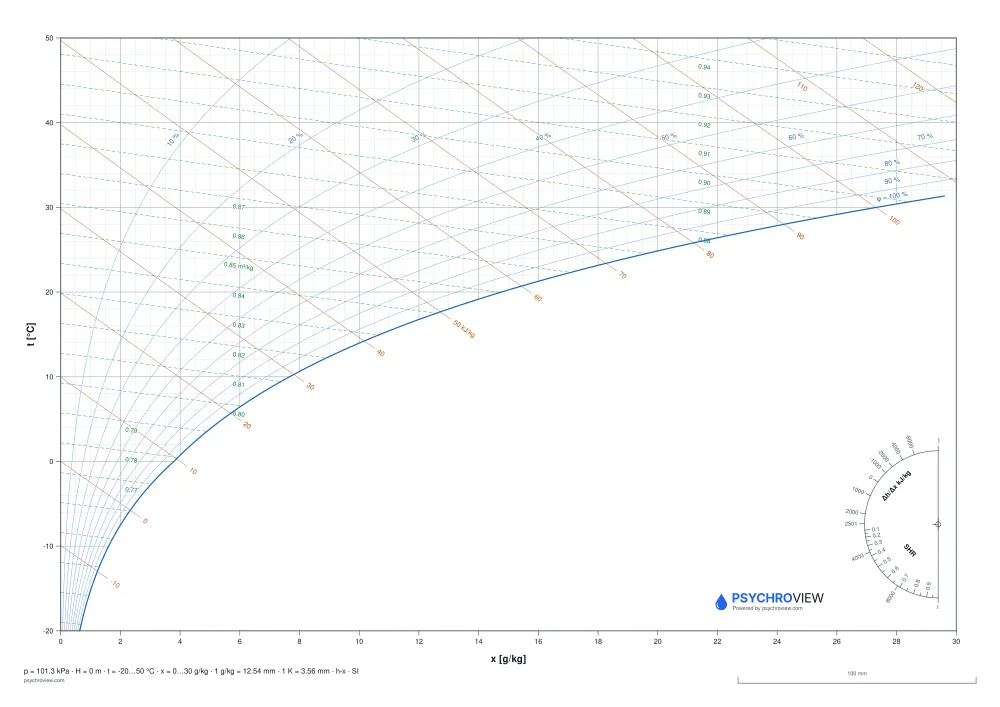
| Chart type | Carrier: dry-bulb horizontal, humidity ratio vertical — ASHRAE and manufacturers’ selection software | Mollier h-x: humidity ratio horizontal, enthalpy on an oblique axis — central Europe |
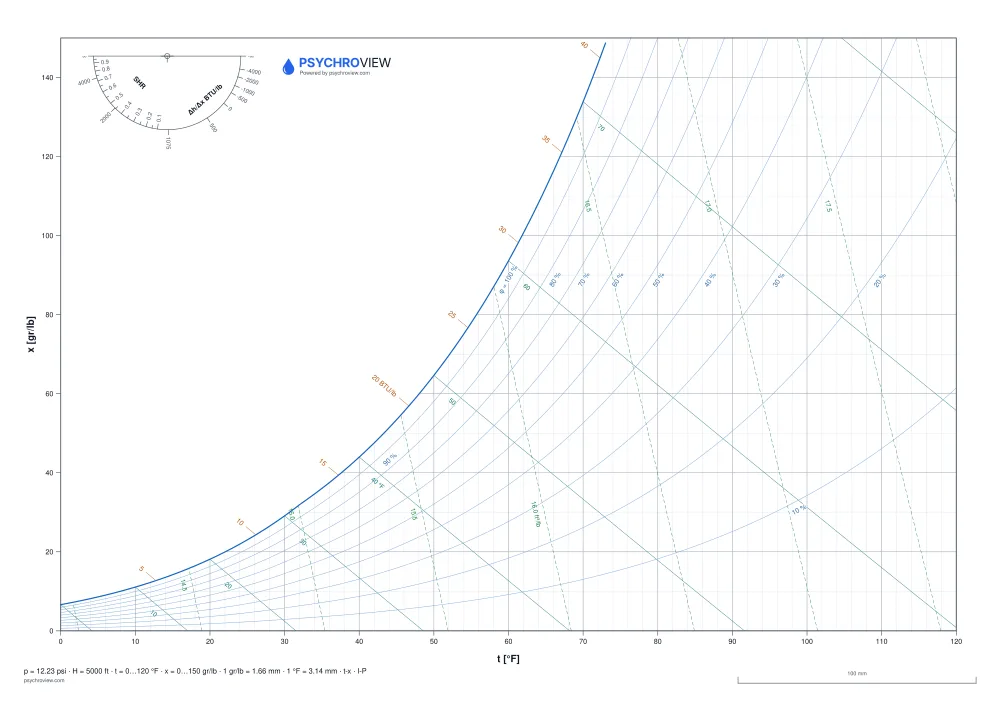
| Pressure | By the altitude of the site, not the address of the office — Altitude and pressure table | The same, only in metres and kilopascals |
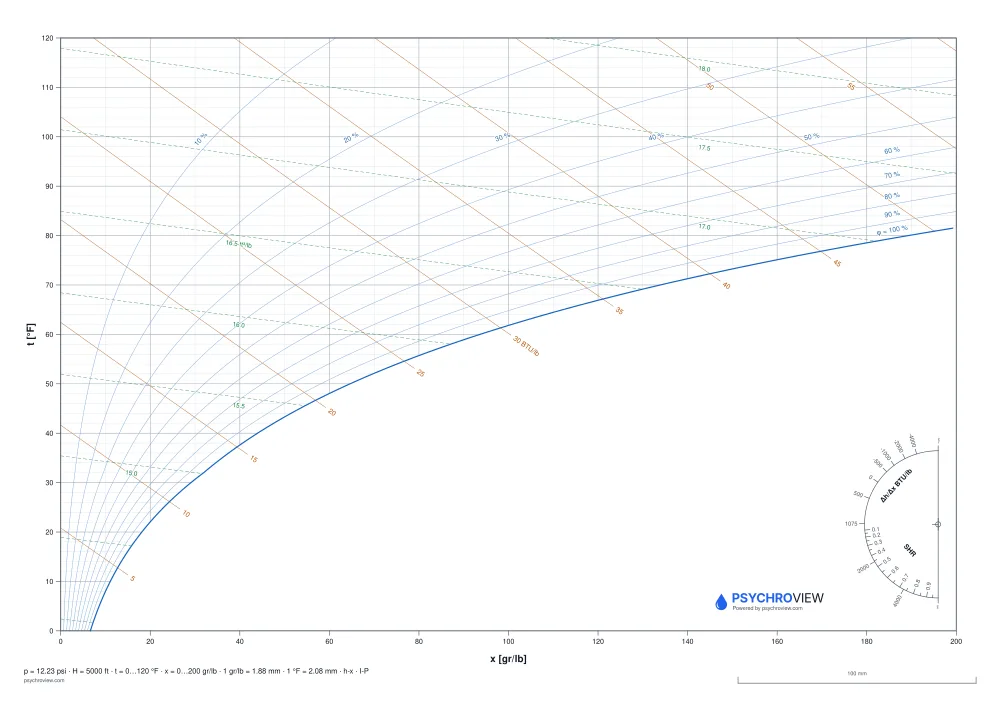
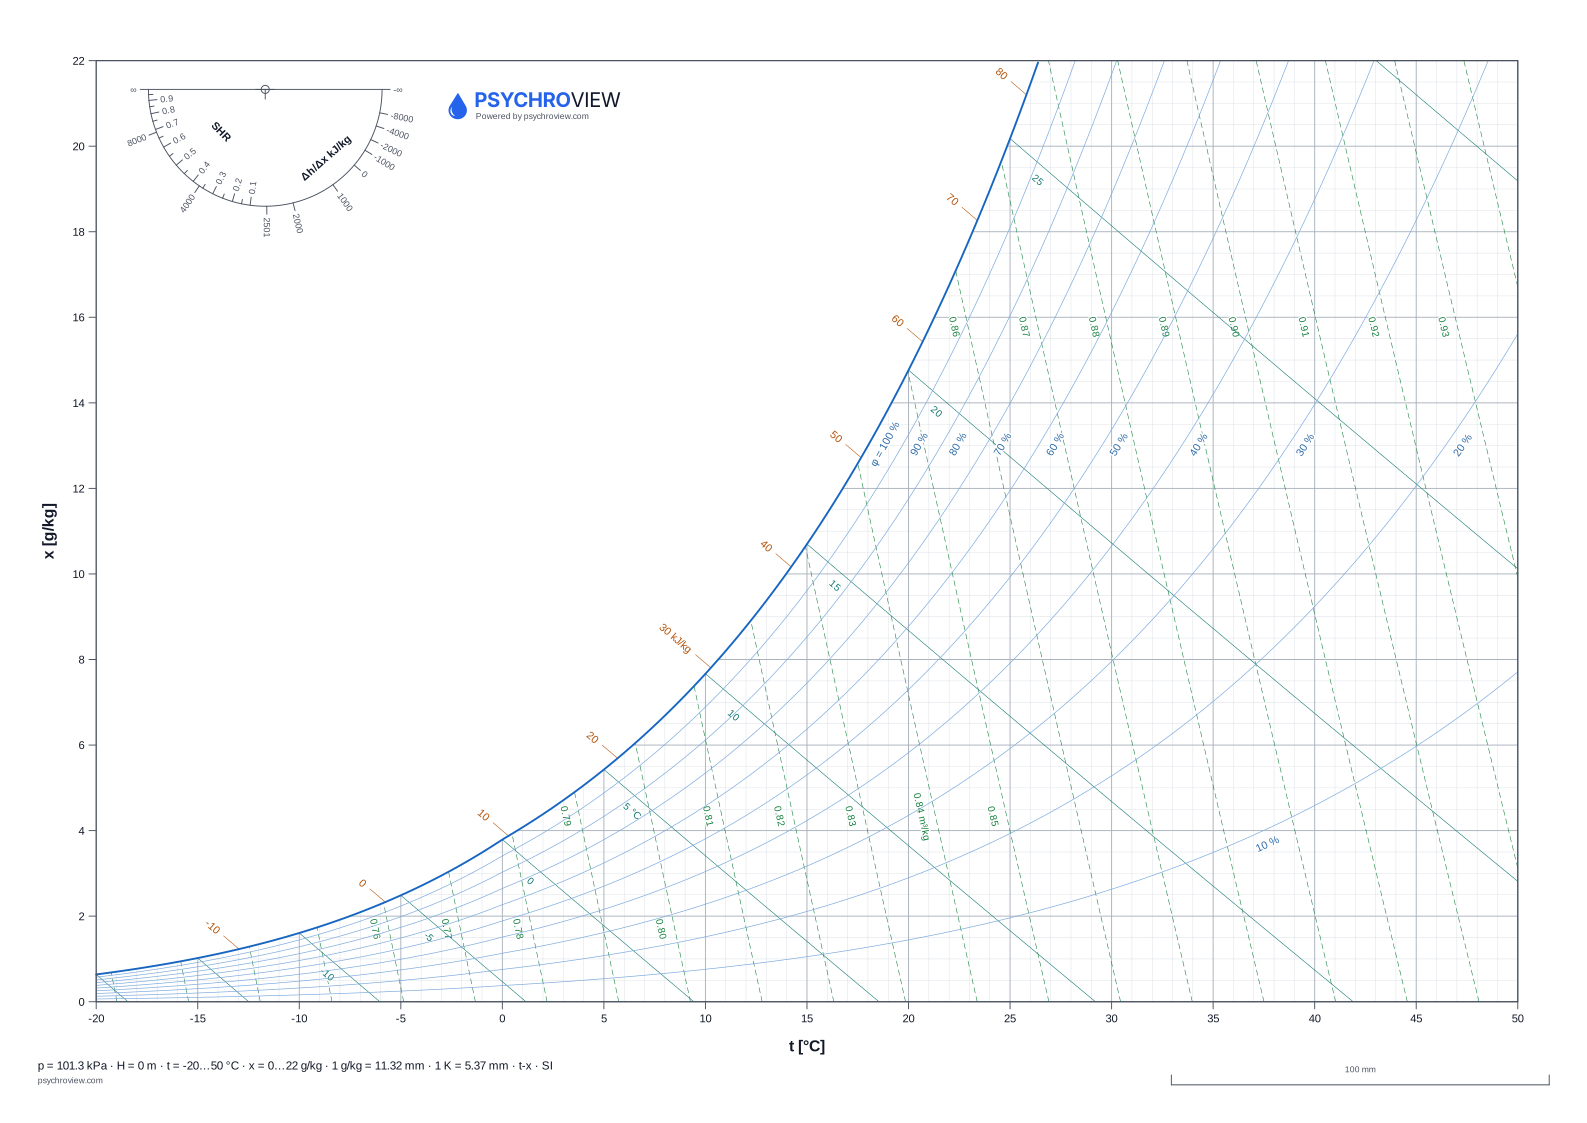
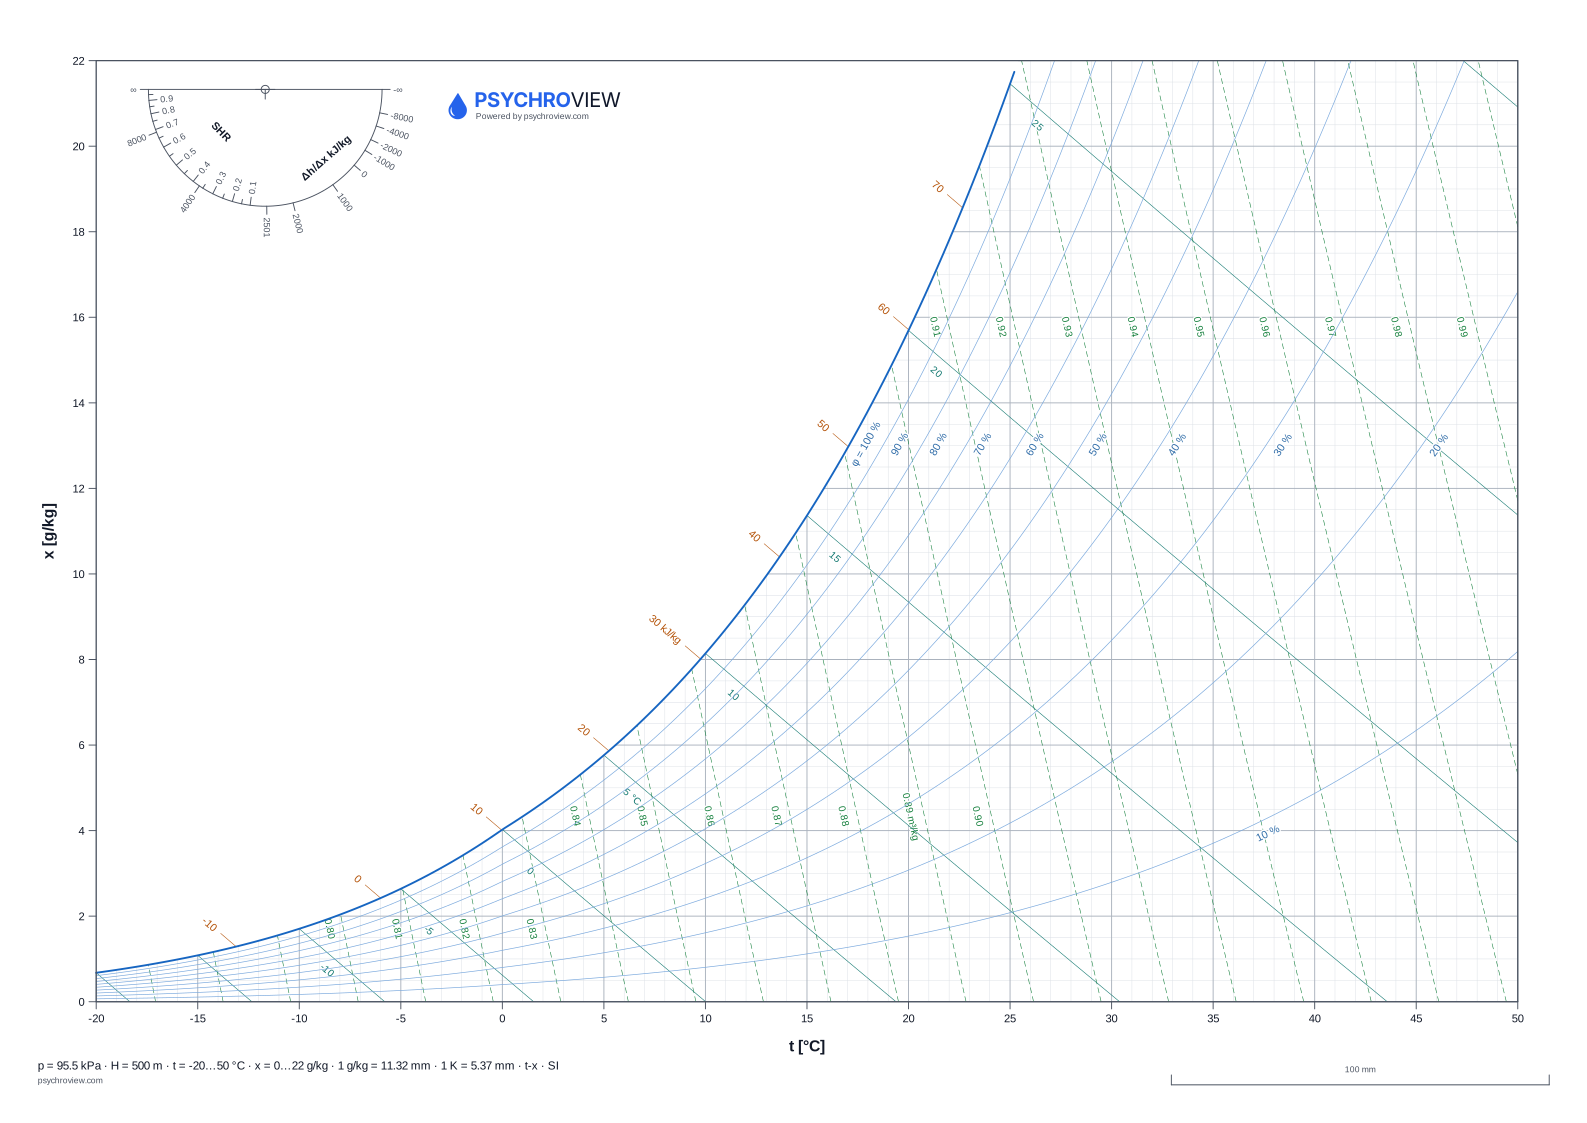
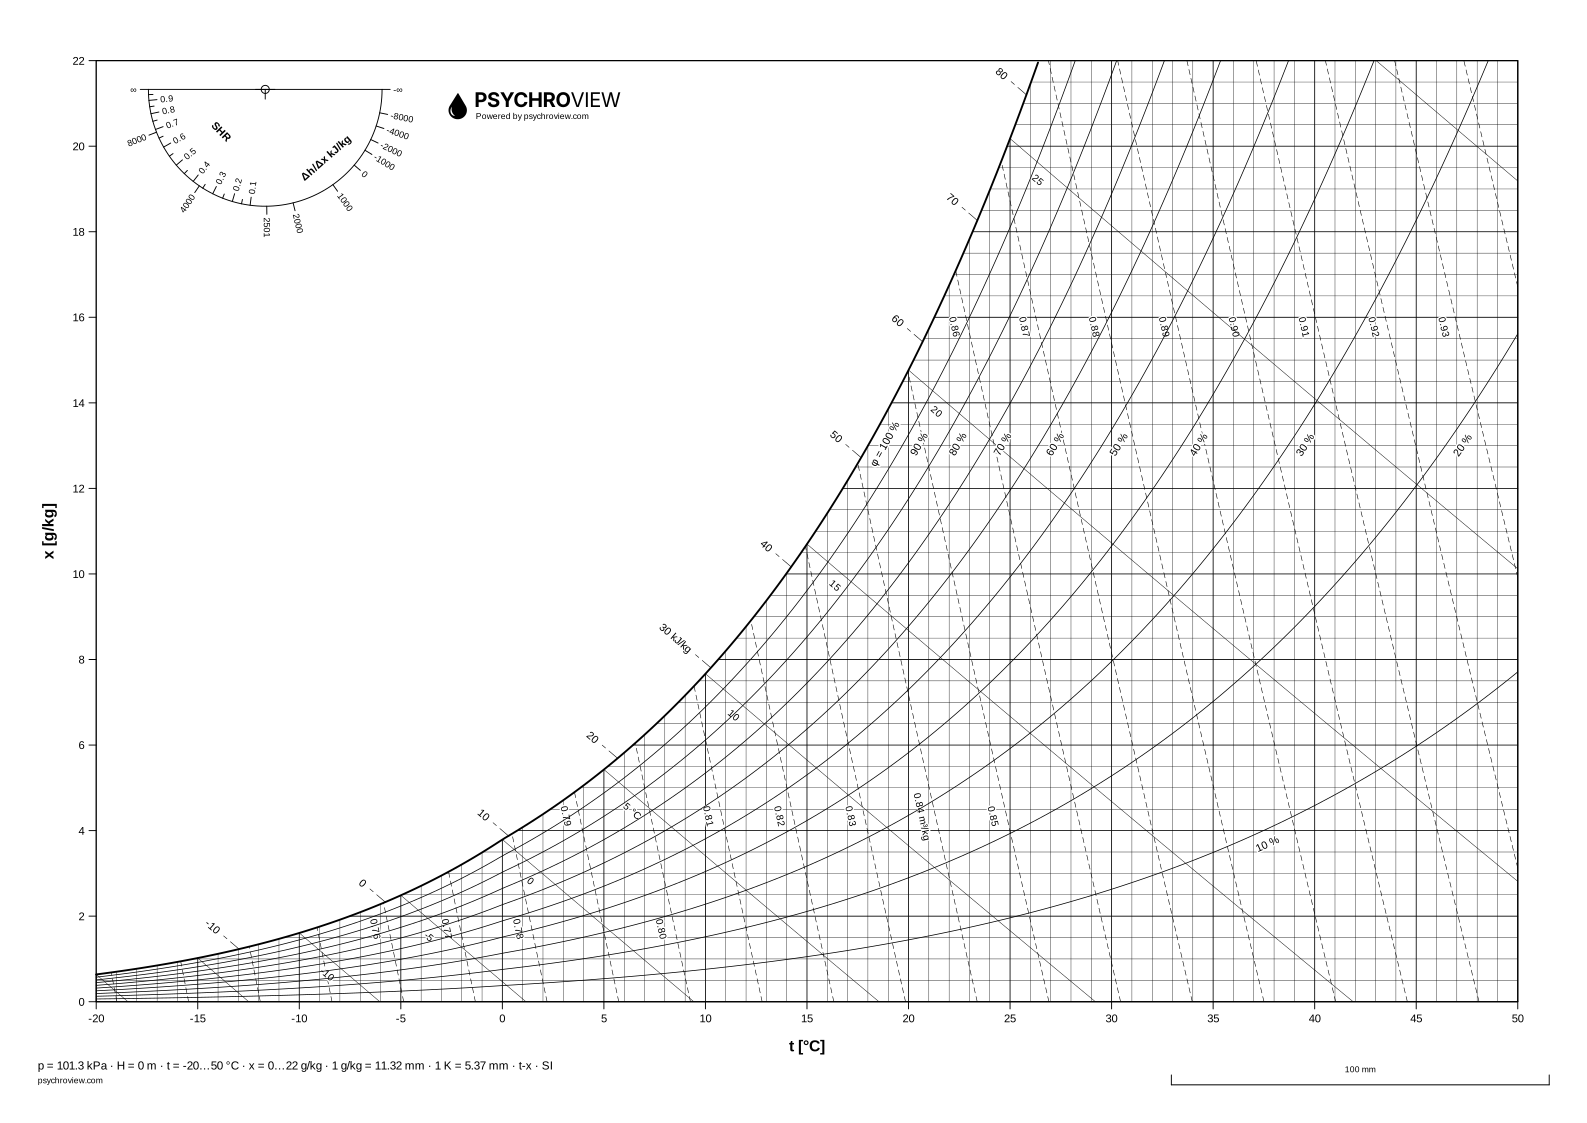
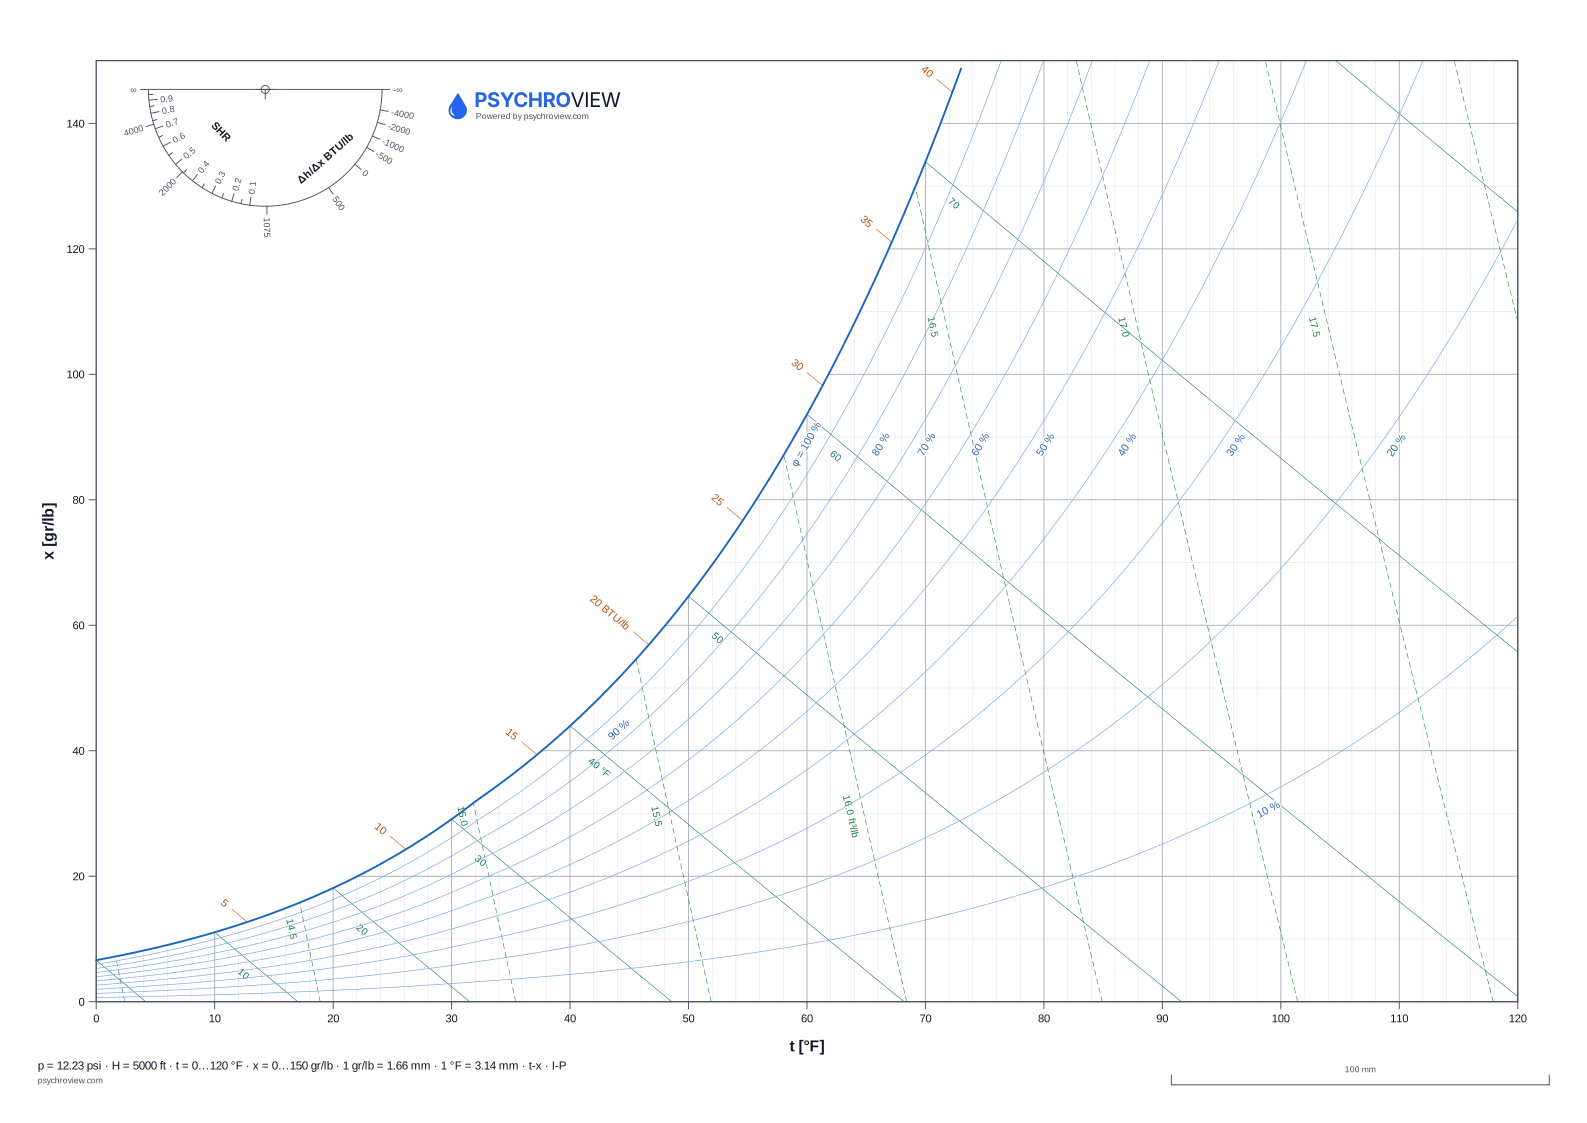
Psychrometric charts (Carrier)
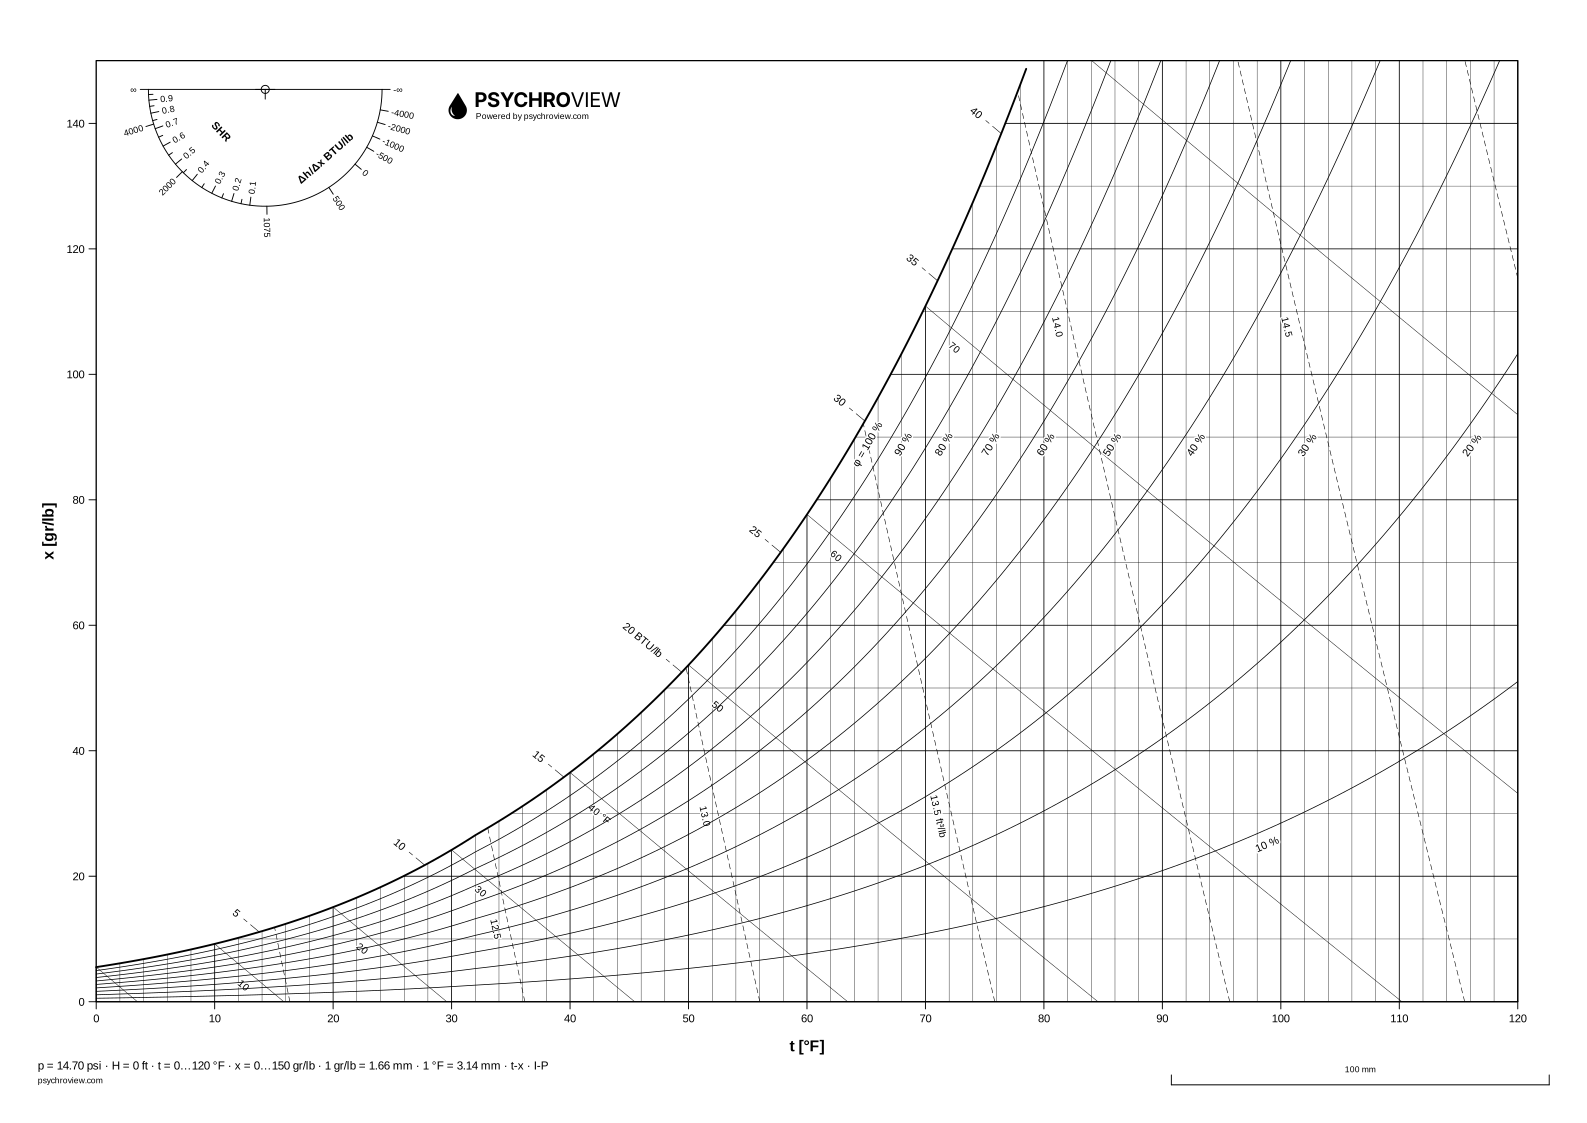
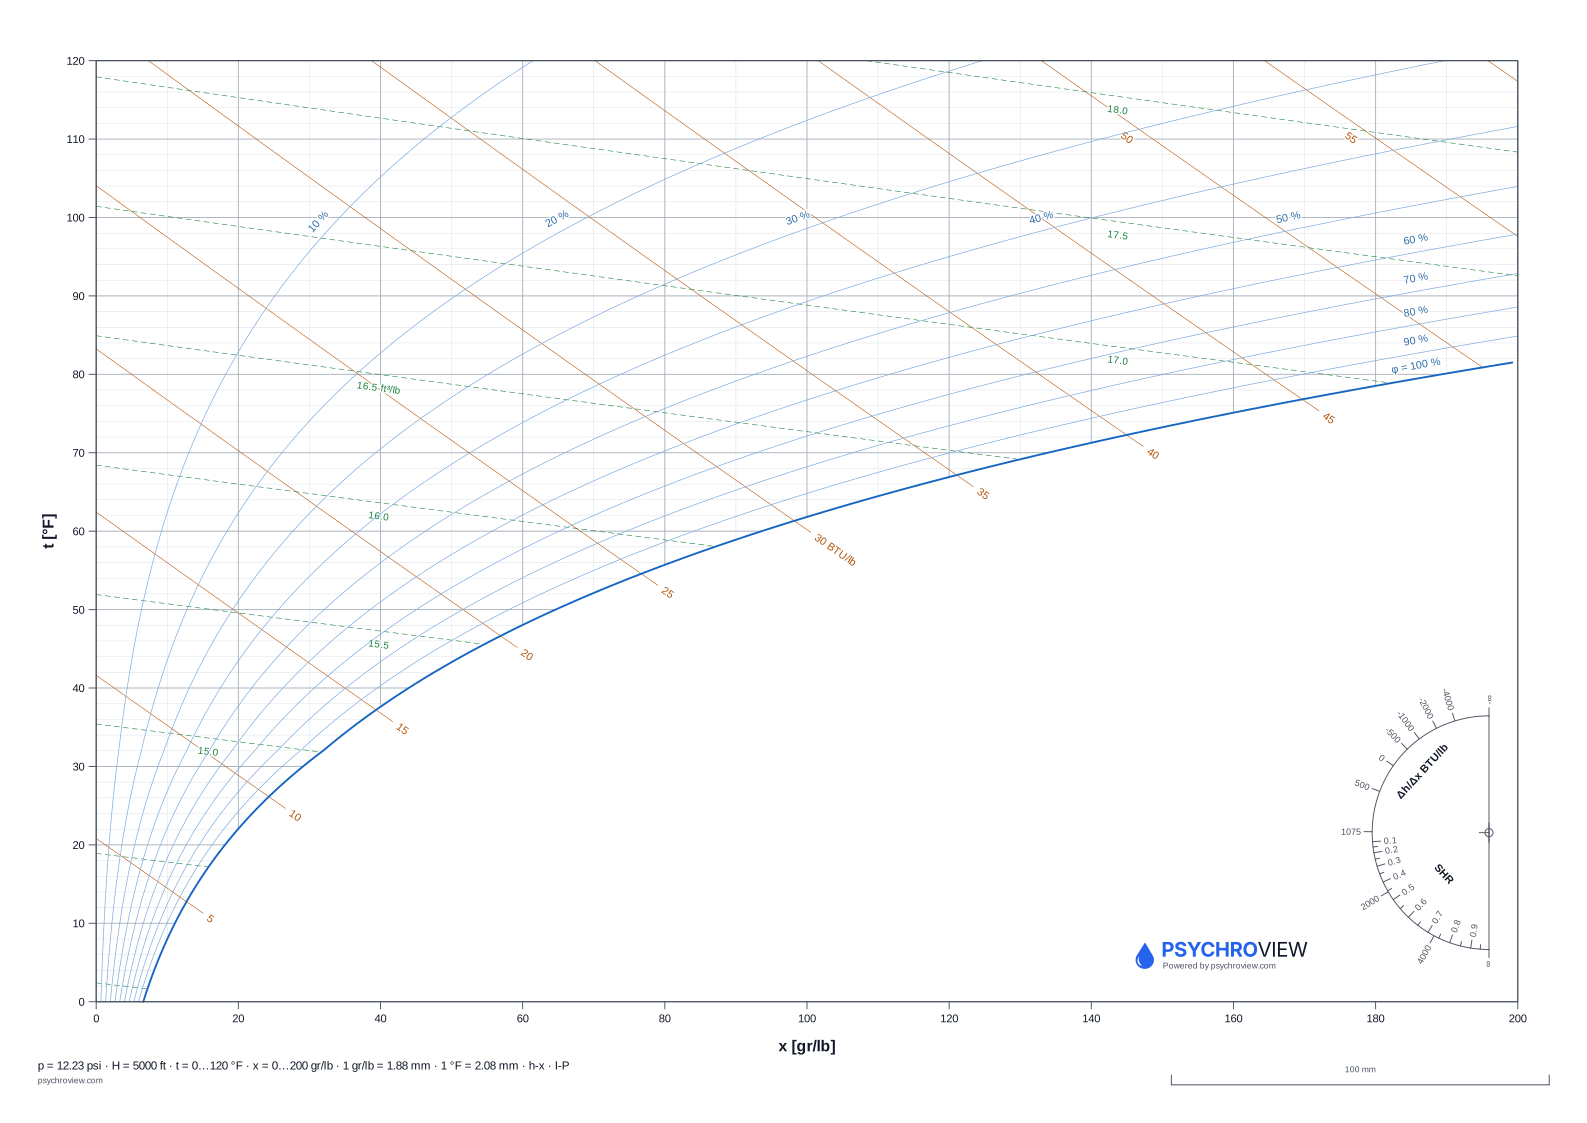
How to read a psychrometric chart →Dry-bulb temperature horizontal, humidity ratio vertical — the ASHRAE convention. Wet-bulb lines fall to the right and the saturation line closes the chart on the left.
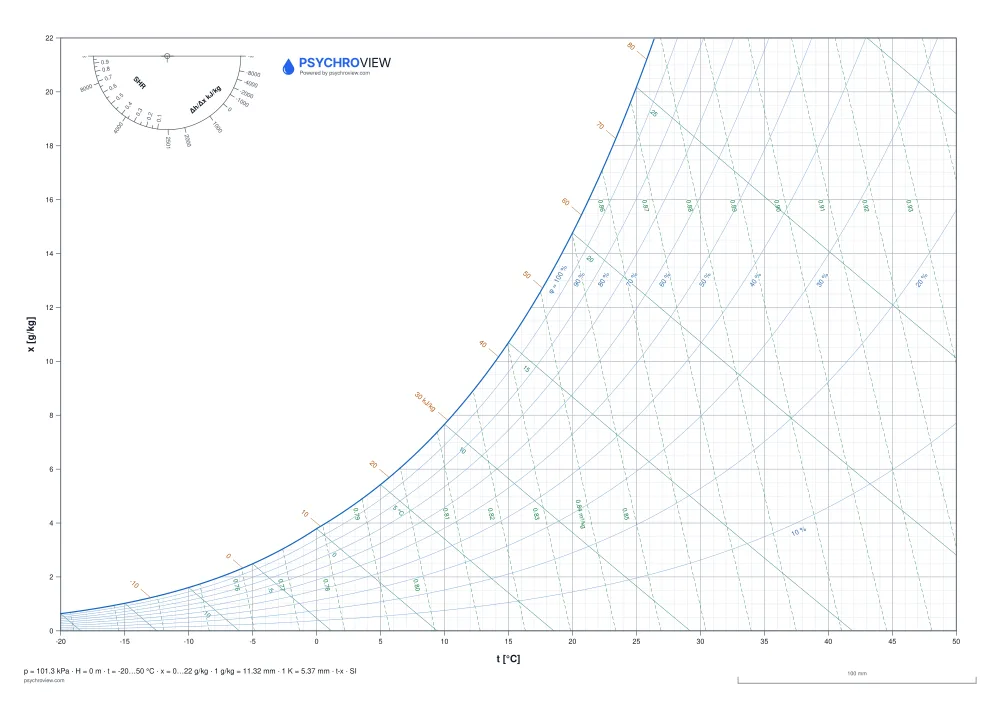
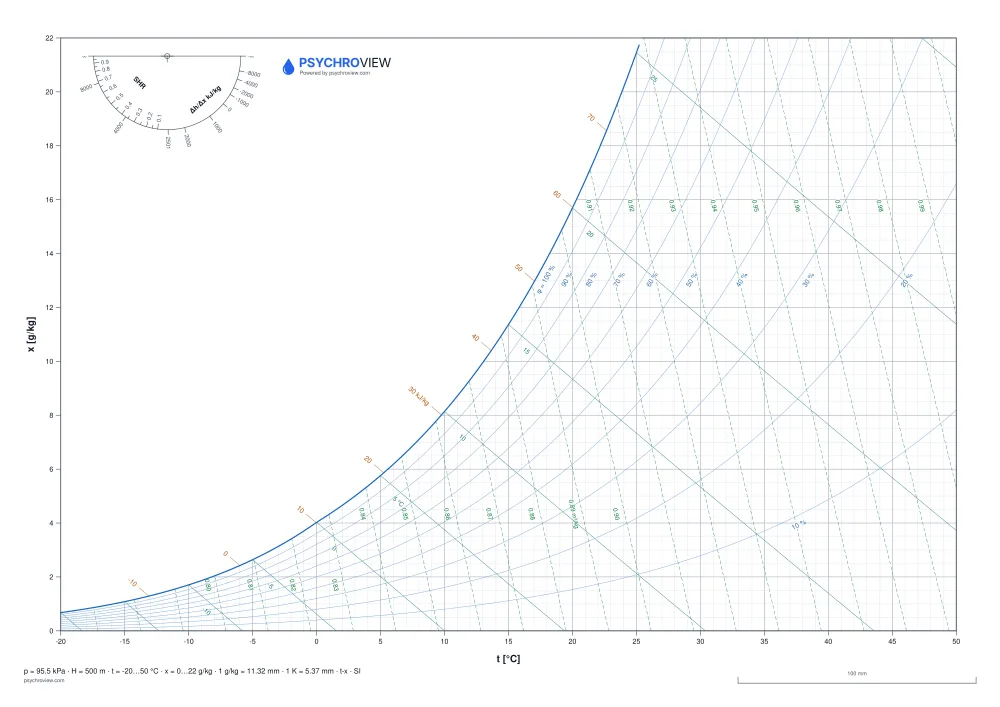
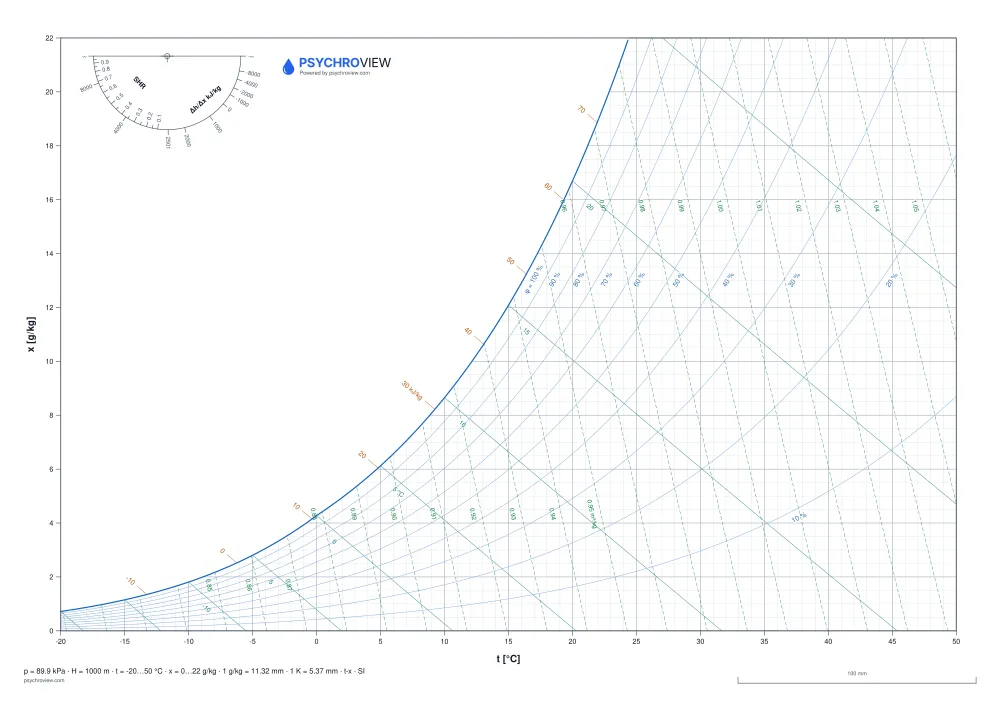
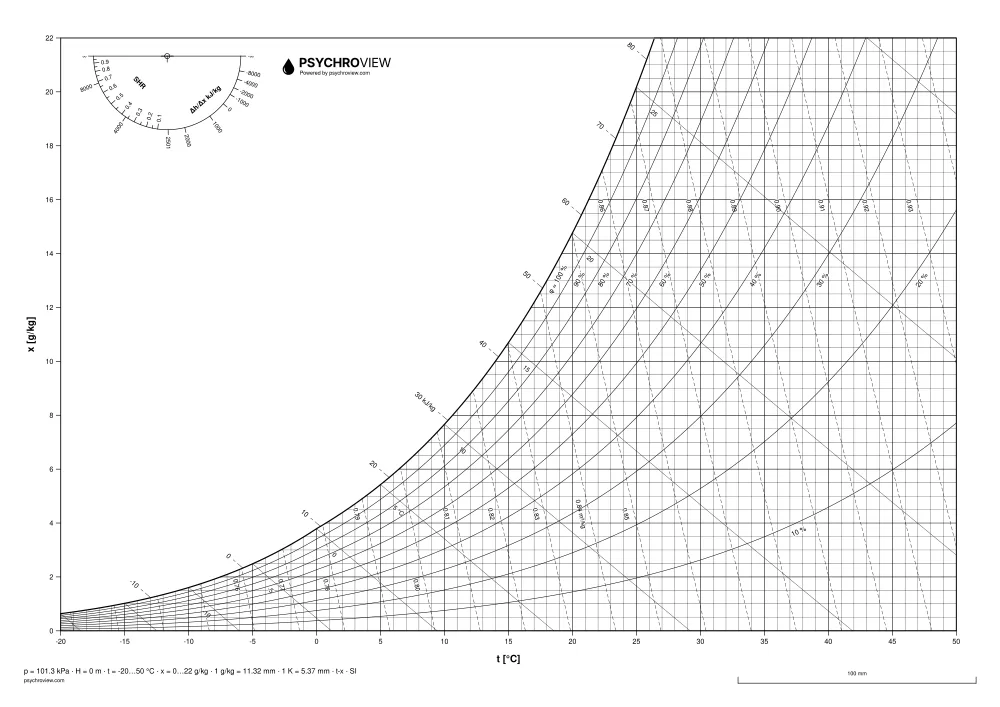
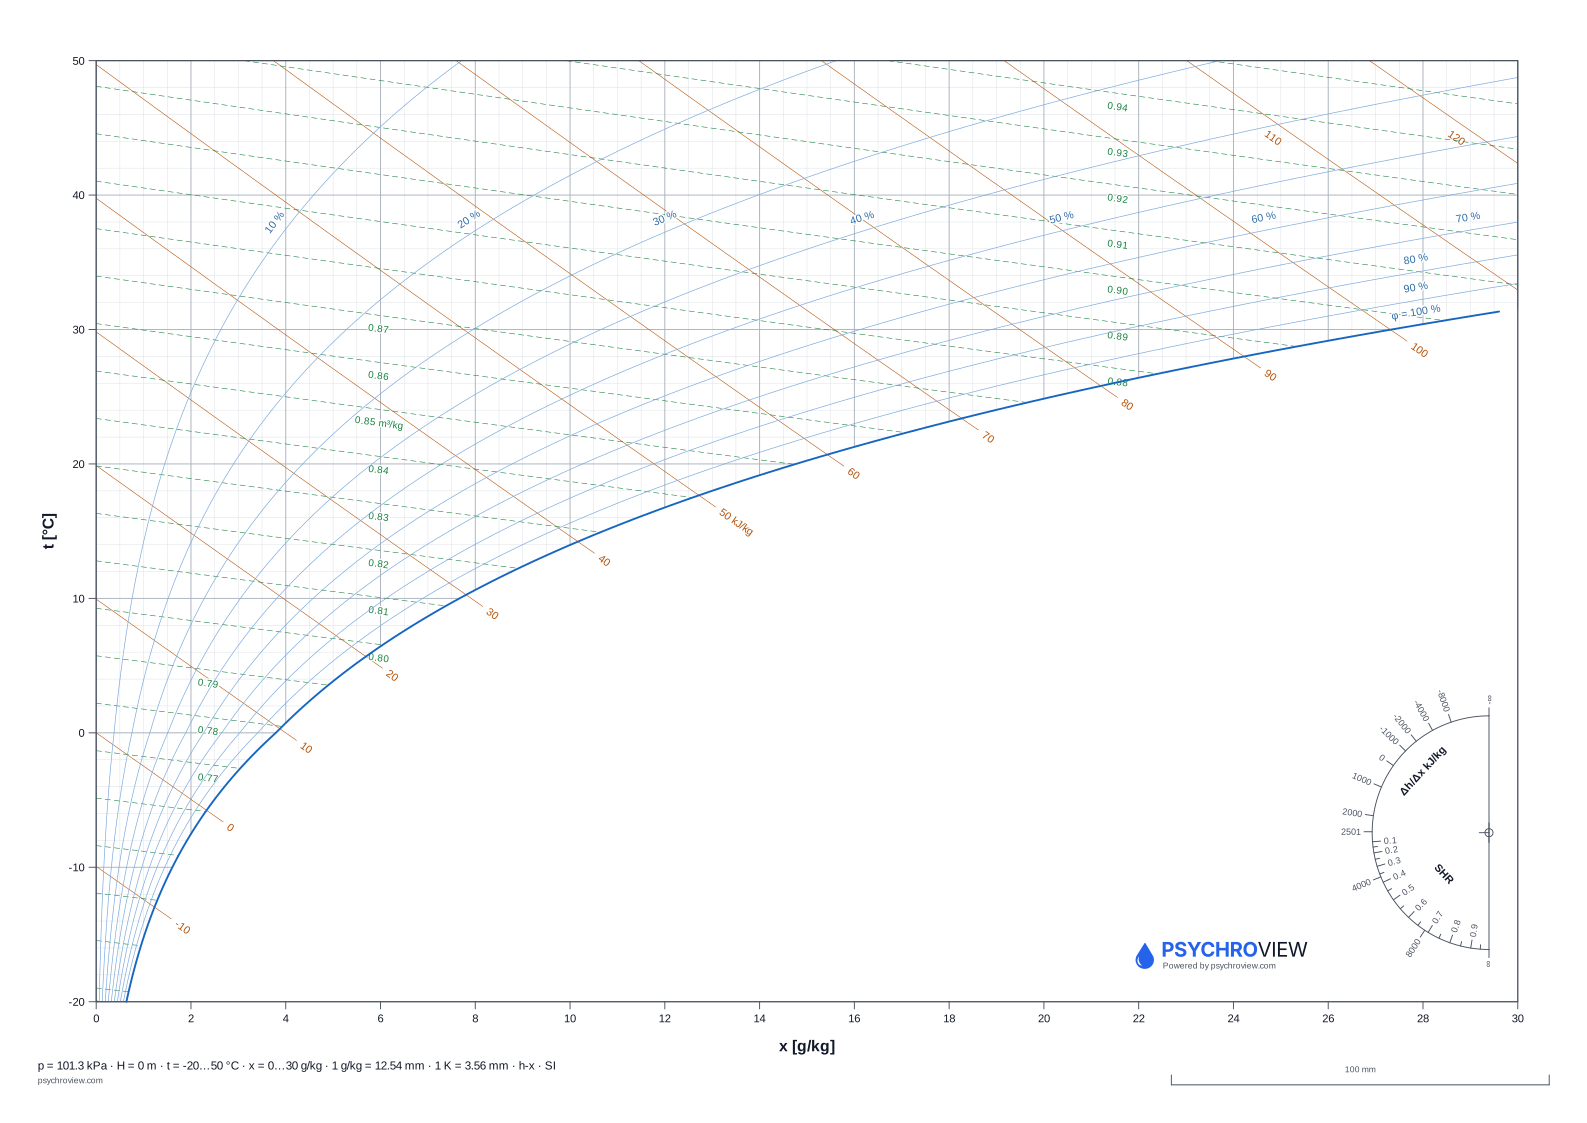
Mollier h-x charts
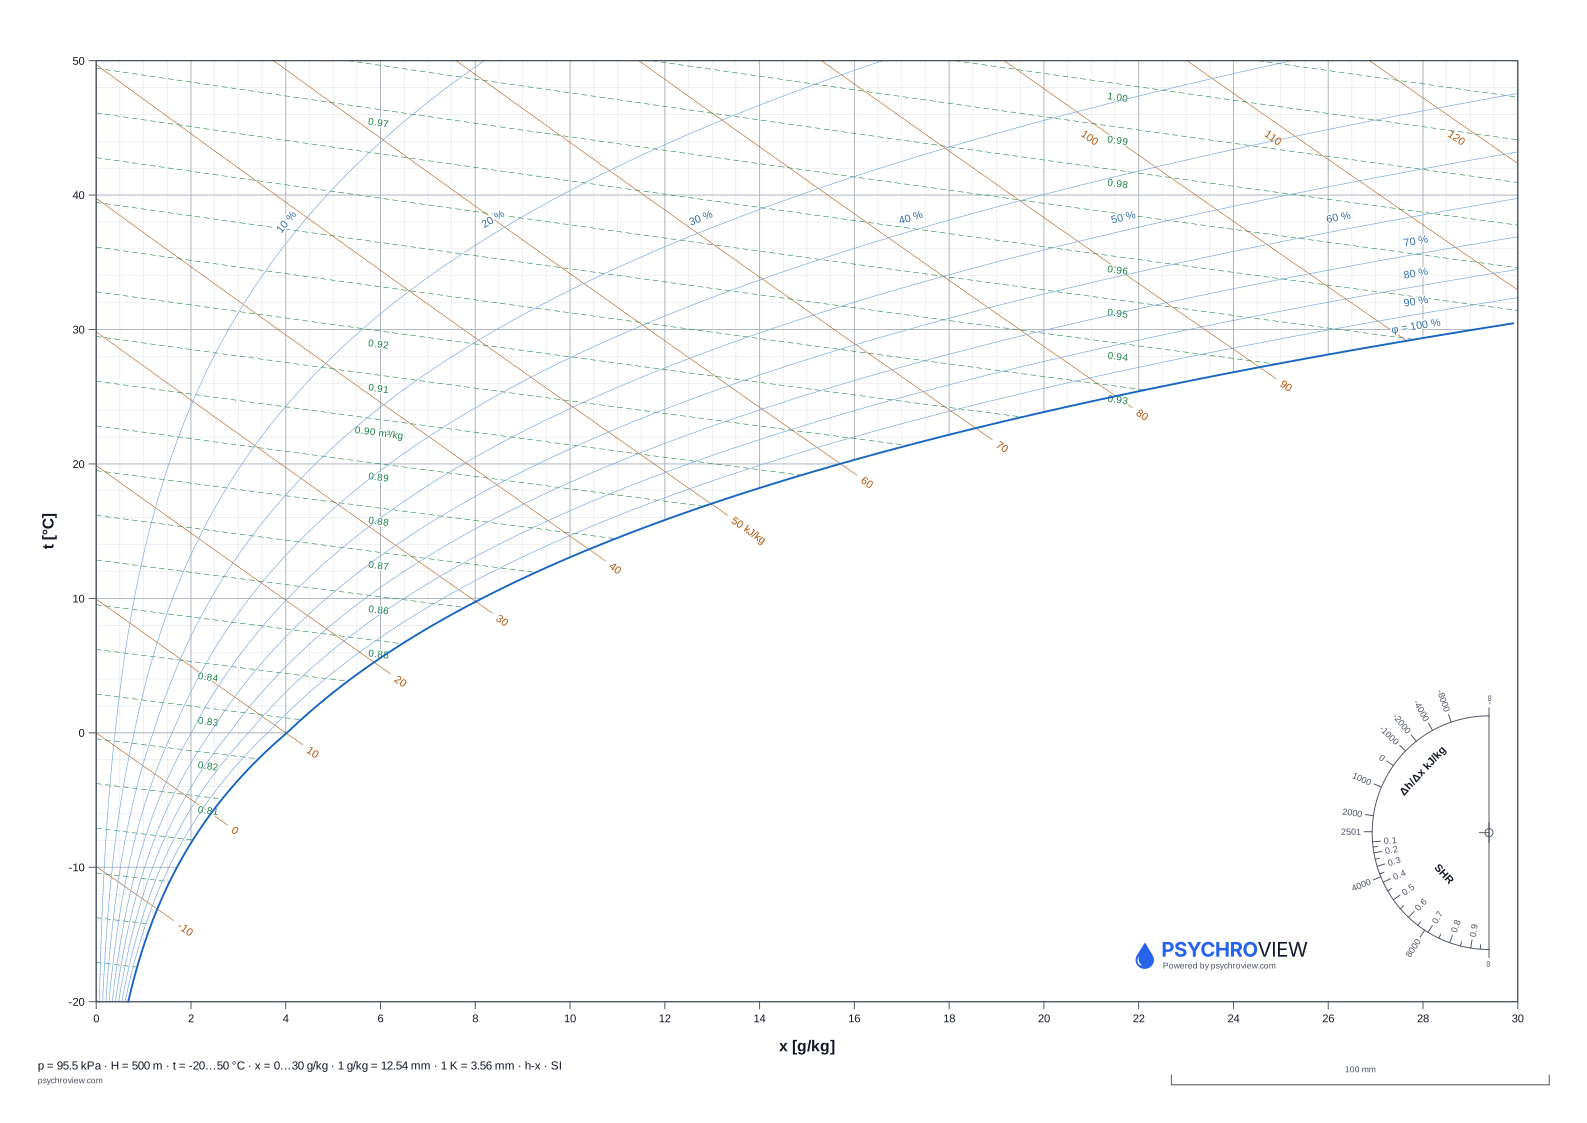
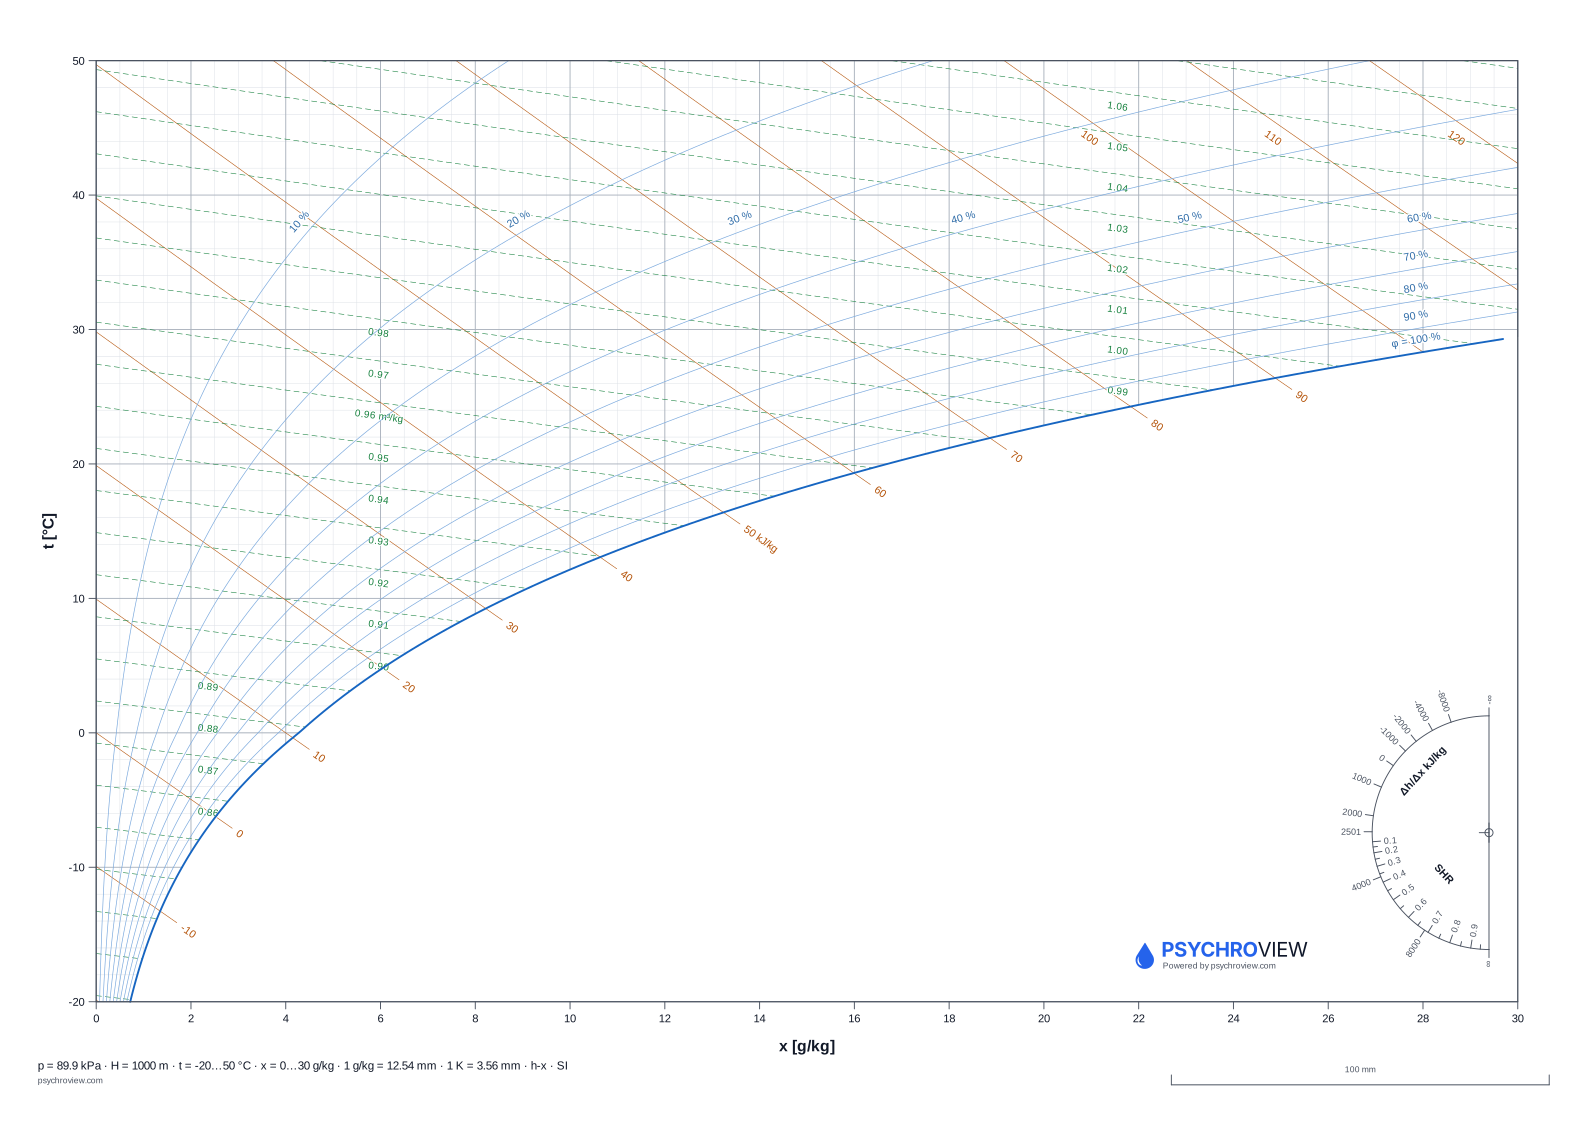
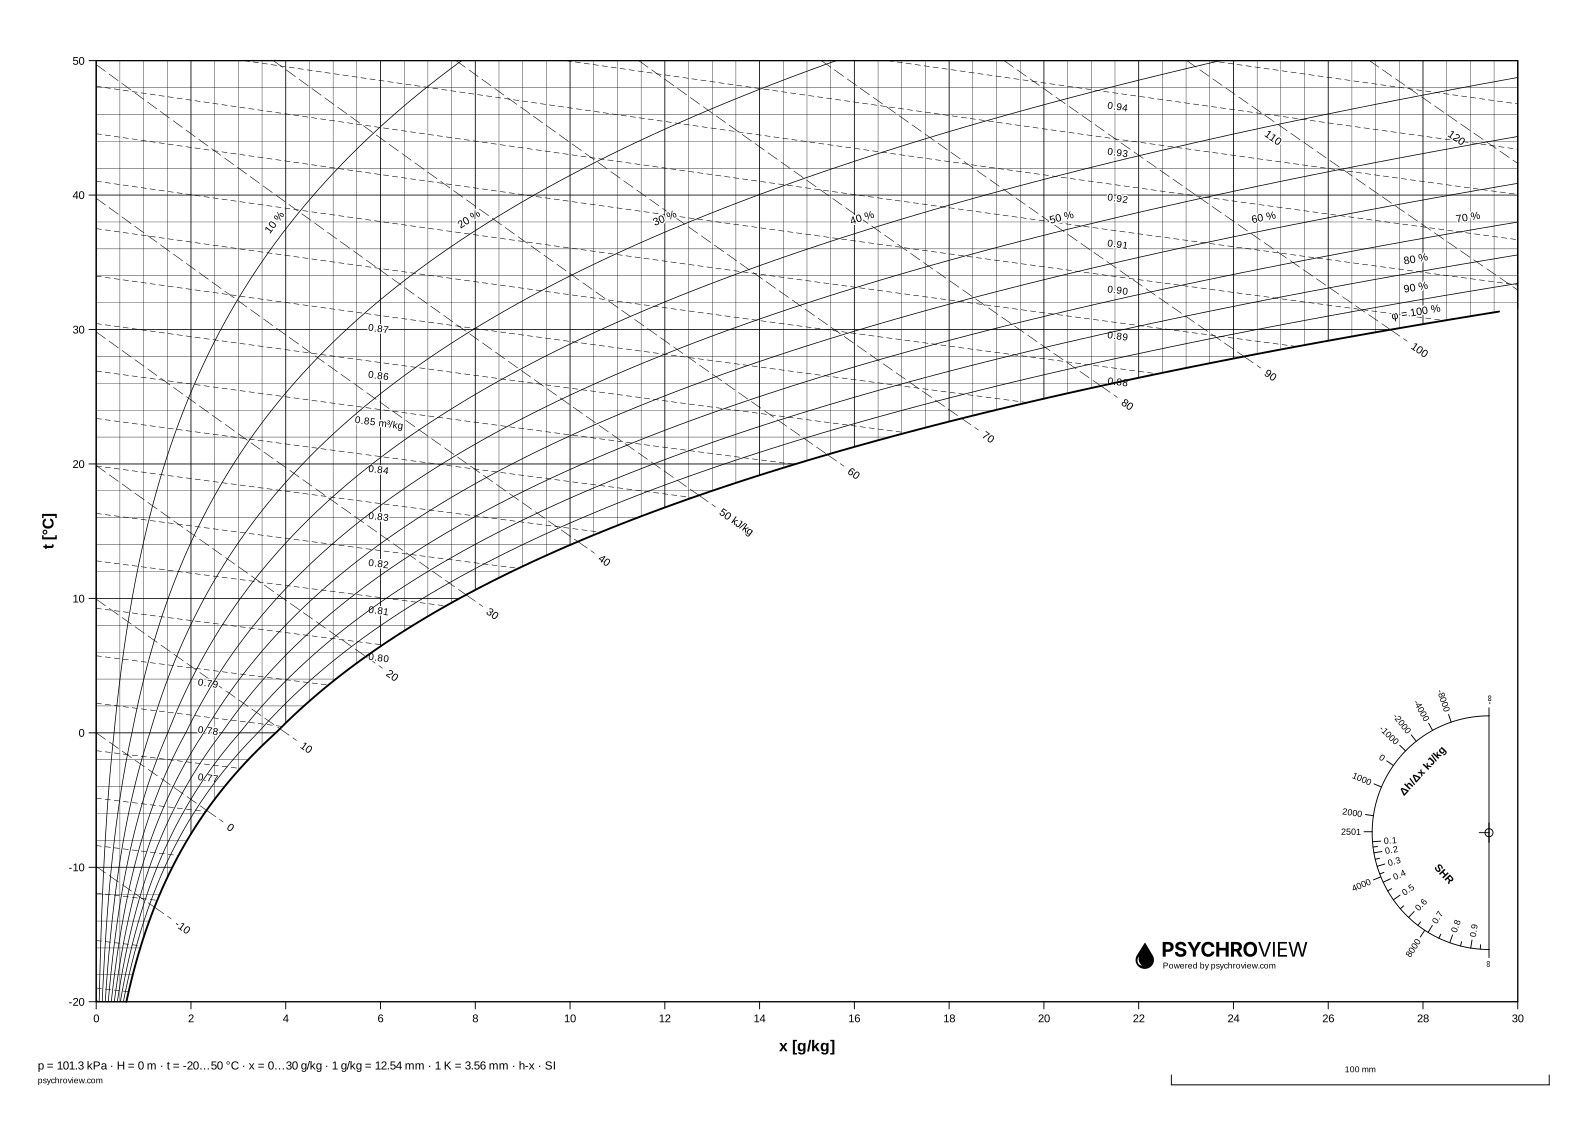
How to read a Mollier chart →Humidity ratio along the horizontal axis, enthalpy oblique — the central-European convention. Temperature rises to the right and the saturation line sweeps up from the lower left.
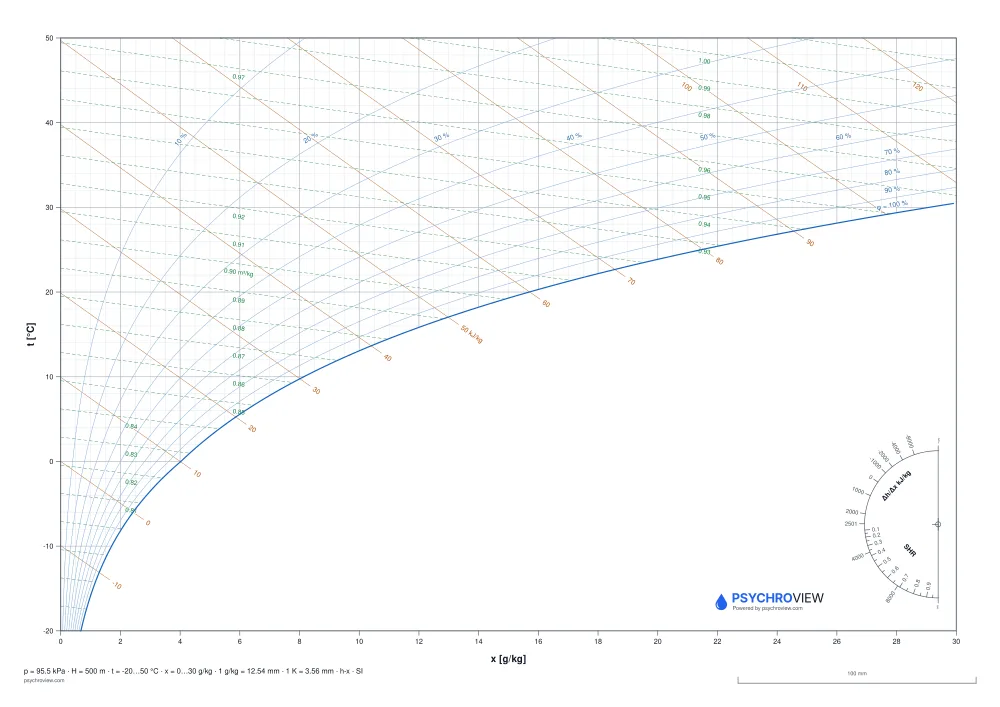
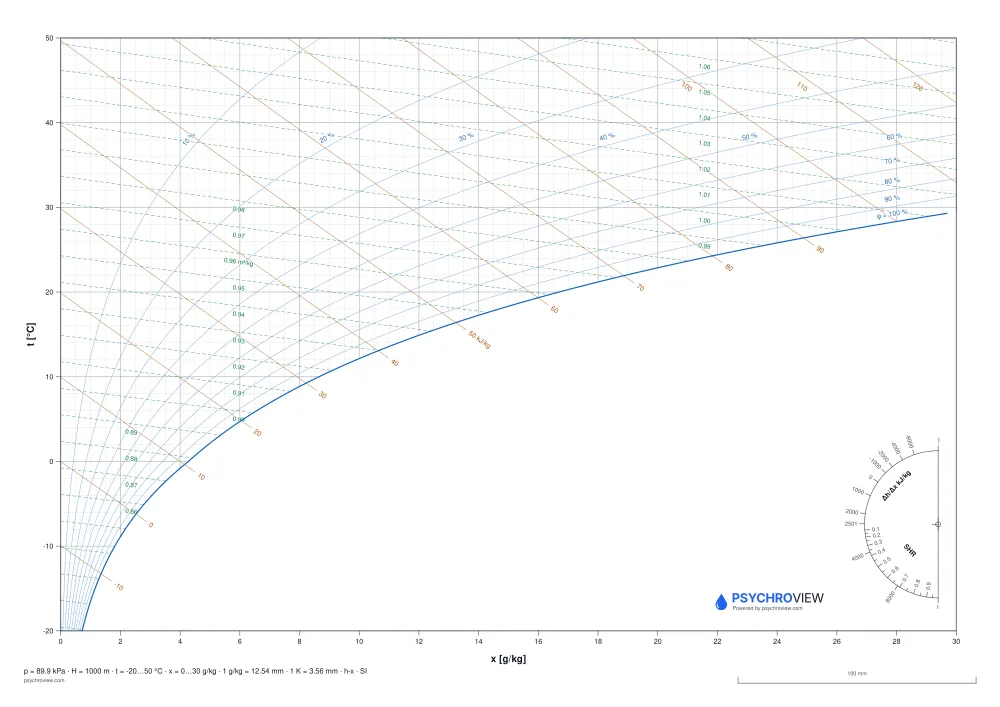
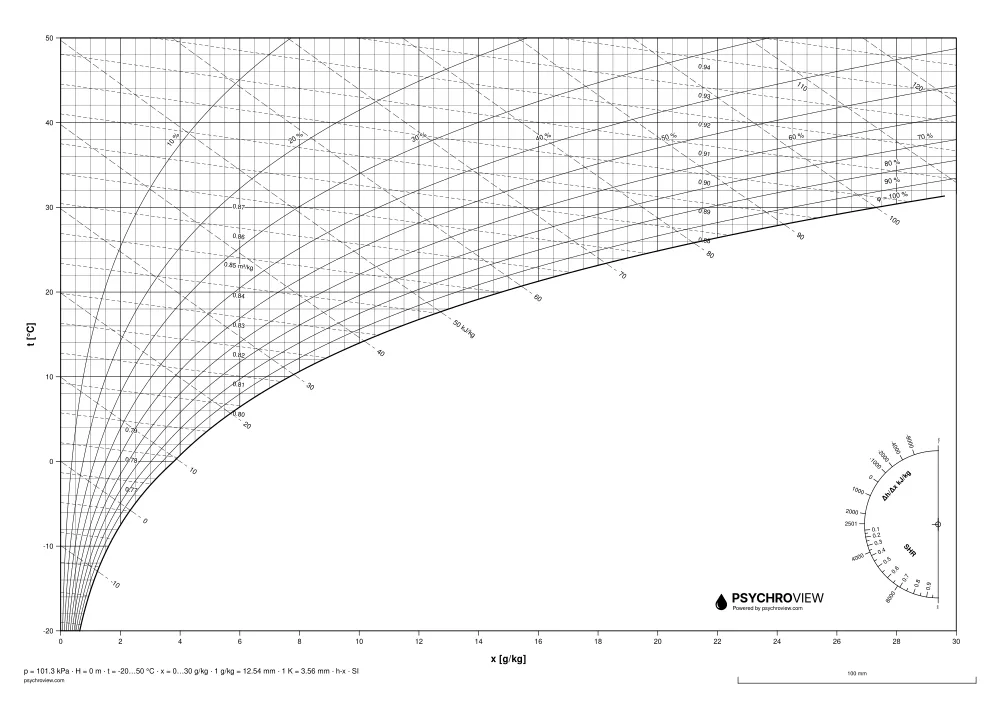
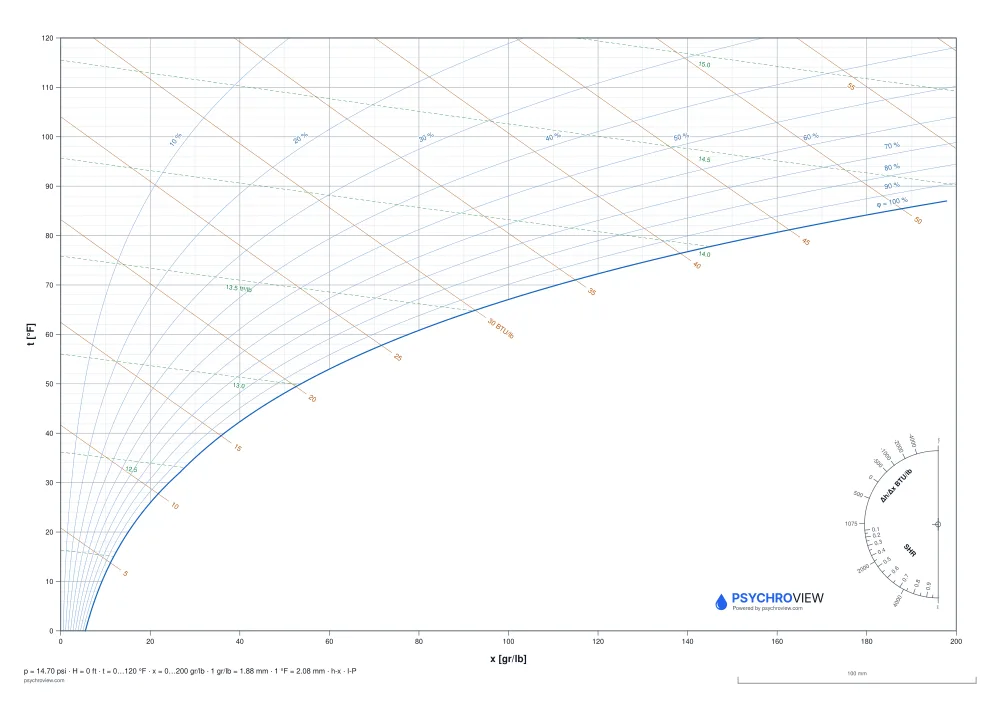
Working in CAD?
The same charts are available as DXF with named layers — insert one into your drawing, switch off what gets in the way and draw your process on your own layer.
Psychrometric chart as DXF →Altitude and barometric pressure
A sheet is drawn for one pressure and that pressure is printed in its stamp. Pressure falls with altitude, so a sea-level sheet read in Denver gives a slightly different relative humidity and dew point.
Up to about 1,000 ft the difference stays under 3.5 % and you will not see it at the resolution of a pencil line. Higher up, take the sheet for your altitude — or generate your own.
| Place | Altitude | Pressure | Which sheet |
|---|---|---|---|
| Dallas | 420 ft | 29.5 inHg | sea level — Mollier h-x chart · Psychrometric chart (1.5 %) |
| Chicago | 587 ft | 29.3 inHg | sea level — Mollier h-x chart · Psychrometric chart (2.2 %) |
| Atlanta | 1,050 ft | 28.8 inHg | sea level — Mollier h-x chart · Psychrometric chart (3.9 %) |
| Phoenix | 1,086 ft | 28.8 inHg | generator (4.0 %) |
| Salt Lake City | 4,262 ft | 25.6 inHg | 5,000 ft altitude — Mollier h-x chart · Psychrometric chart (2.7 %) |
| Albuquerque | 4,957 ft | 24.9 inHg | 5,000 ft altitude — Mollier h-x chart · Psychrometric chart (0.2 %) |
| Denver | 5,279 ft | 24.6 inHg | 5,000 ft altitude — Mollier h-x chart · Psychrometric chart (1.1 %) |
| Cheyenne | 6,089 ft | 23.9 inHg | generator (4.2 %) |
City elevations: GeoNames (CC BY 4.0). Pressures are computed by the same core that draws the sheets.
Printing the sheets
A4, A3 or letter-size on an office printer
Both PDFs are vector, so they come out at the printer’s full resolution. The sheets are drawn on ISO sizes; on letter-size paper print with “Fit to page” off and accept the slightly larger margin — scaling the page makes the scale printed in the footer a lie.
Check the scale before you measure on it
The footer carries a 100 mm control line with end ticks (50 mm on narrow sheets, and it says so). Lay a ruler on it. If it measures 100 mm — just under 4 inches — the figures in the stamp are true and you can take differences straight off the paper.
ARCH D, ARCH E and other plots
Send the SVG. Its width and height are in millimeters, so a plotter RIP or a print shop gets the physical size right without being told. The A3 PDF enlarges cleanly too — a vector just saves one conversion.
Copier and black-and-white printing
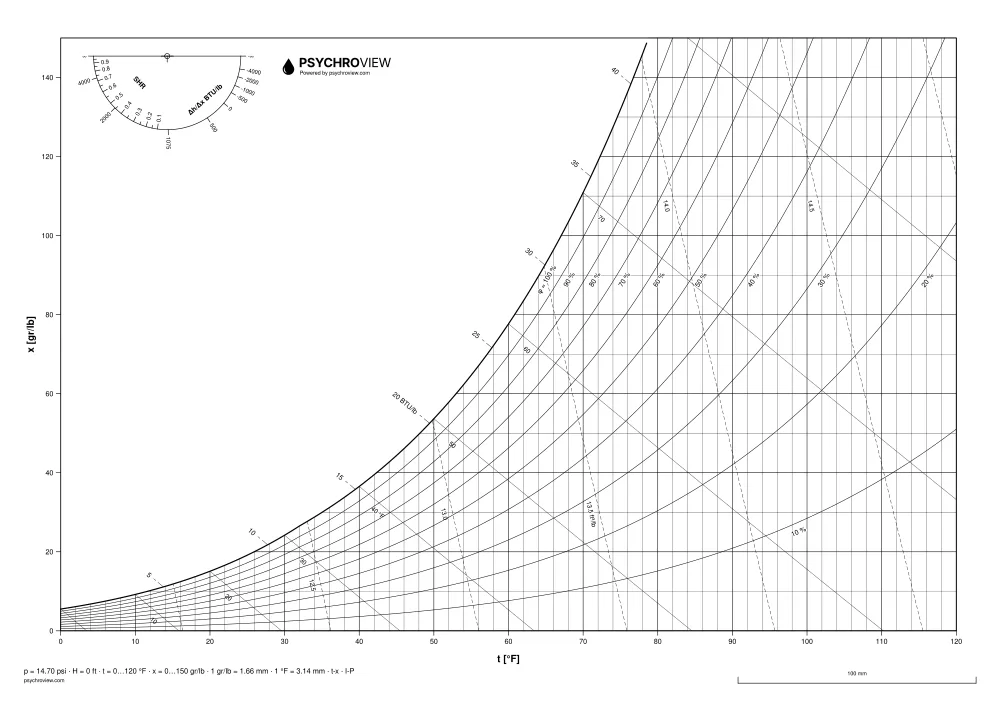
Three variants are drawn in a single ink. Pale blue φ curves vanish on a copier, so the mono sheets separate the families by line weight and dash pattern instead of color.
What you may do with the files
Free to use, including in commercial projects and in teaching. You may print the sheets, hand them out and share the files unchanged, and you may of course draw on your own printout — that is what a blank chart is for.
What you may not do: sell the files, or remove the source identification from them. Formally this is not a Creative Commons licence — CC BY would require attribution on every printout, which nobody does, and CC BY-ND would forbid drawing on the sheet, which is the whole point.
Frequently asked questions
Are the charts really free? +
Yes. No sign-up, no e-mail, no watermark across the drawing. The only branding is the mark and the domain in the footer strip, outside the plotting area.
Which sheet should I pick? +
Pick the unit system first: I-P (°F, gr/lb, Btu/lb) for US practice, SI (°C, g/kg, kJ/kg) elsewhere. Then the chart type — the Carrier psychrometric chart is the ASHRAE convention, the Mollier h-x chart the central-European one; the physics is identical, only the axes are swapped. Finally the altitude of the site: sea level or 5,000 ft.
Why does altitude matter on a psychrometric chart? +
Barometric pressure sets the saturation humidity ratio. At 5,000 ft the pressure is about 84 kPa (24.9 in Hg) instead of 101.3 kPa, and saturated air holds noticeably more moisture per pound of dry air. A sea-level sheet used in Denver therefore gives a wrong relative humidity and a wrong dew point. The whole sheet is drawn for one pressure, printed in the footer.
May I use the chart in a report, in a thesis or in class? +
Yes, all of that is covered, including commercial projects. Keep the footer strip intact so a reader can see which pressure and which unit system the sheet was drawn for.
I need a different temperature range or pressure. +
Use the generator on this page: you set the pressure or the altitude, the temperature and humidity ranges, the paper format and the layers, and out comes a PDF, an SVG or a DXF. Beyond that, the application draws processes into the same chart and computes the states.
What is the difference between the PDF and the SVG? +
Both are vector and identical in content. The PDF is what you send to a printer; the SVG is what you send to a plotter or open in Inkscape or a CAD tool, because its dimensions are stated in millimeters. Only the A3 SVG is published — a vector scales to any size on its own.
Can I print the sheet on A4 and measure on it? +
Yes. The A4 PDF is drawn to the same scale rules as the A3 one, only smaller, and the footer states how many millimetres one unit is. Print at 100 %, check the control line with a ruler, and you can take differences straight off the paper. On A4 you read one significant figure less than on A3 — for a check calculation that is enough, for a report take the A3.
Does the sheet still work above 50 °C, for drying? +
No, the ready-made sheets stop at 50 °C ( 122 °F). Drying runs far beyond that, so use the generator on this page: set the temperature range you need and it draws the sheet for it. Above about 90 °C the saturation line stops being meaningful at atmospheric pressure, so that is where the generator stops too.
What is the difference between a Mollier chart and a psychrometric chart? +
The physics is identical, the axes are swapped. The Mollier h-x chart has humidity ratio horizontal and enthalpy on an oblique axis — the central-European convention. The Carrier psychrometric chart has dry-bulb temperature horizontal and humidity ratio vertical — the ASHRAE convention. A state point sits in a different place on the sheet, but reads the same numbers.
Need the processes drawn in, not just the grid?
PsychroView chains heating, cooling, heat recovery, humidification and mixing on the same chart and exports the result as vector PDF, DXF or PNG.
Launch the appDownloading. The same sheet with the processes drawn in and the states calculated is in the application.