How to read a psychrometric chart — and a blank sheet to download
Seven blank sheets in vector PDF and SVG, in I-P and SI, plus what the grid itself cannot say: which family is which, and how to turn a load into a line.
Download the psychrometric sheets
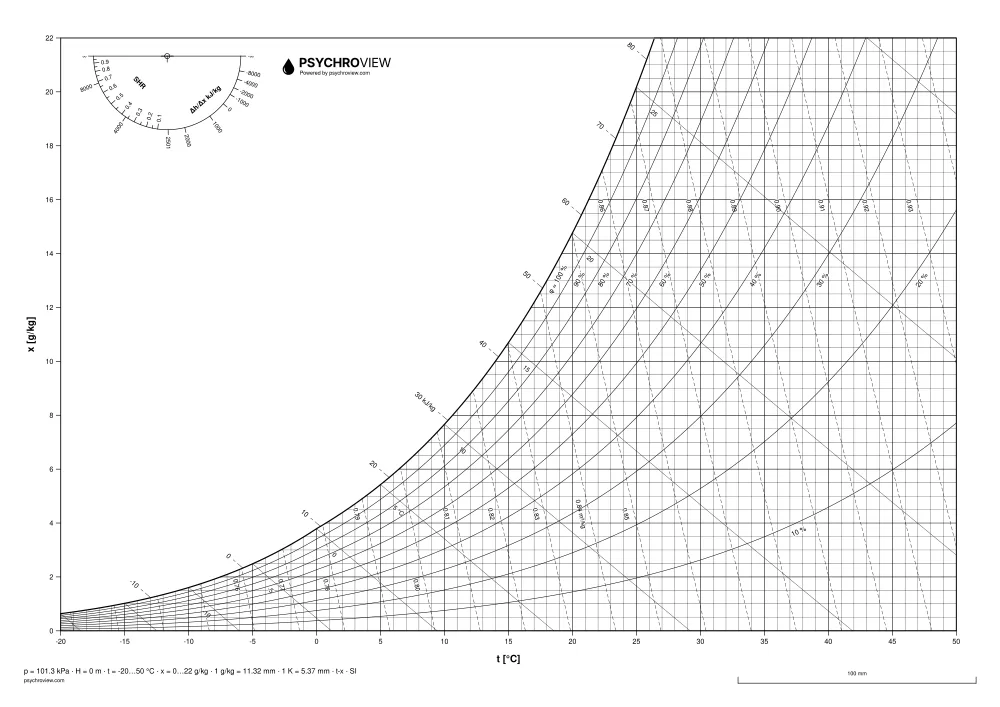
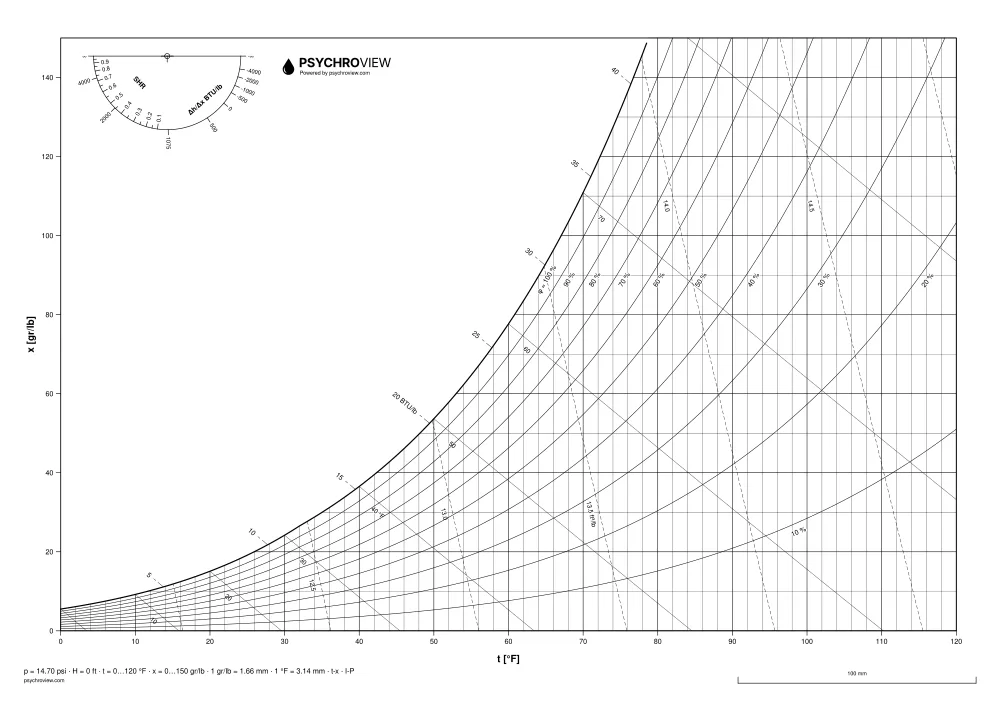
Vector PDF in A4 and A3, SVG in A3. SI and I-P, sea level, 500 m and 5 000 ft, plus black-and-white variants for photocopiers.
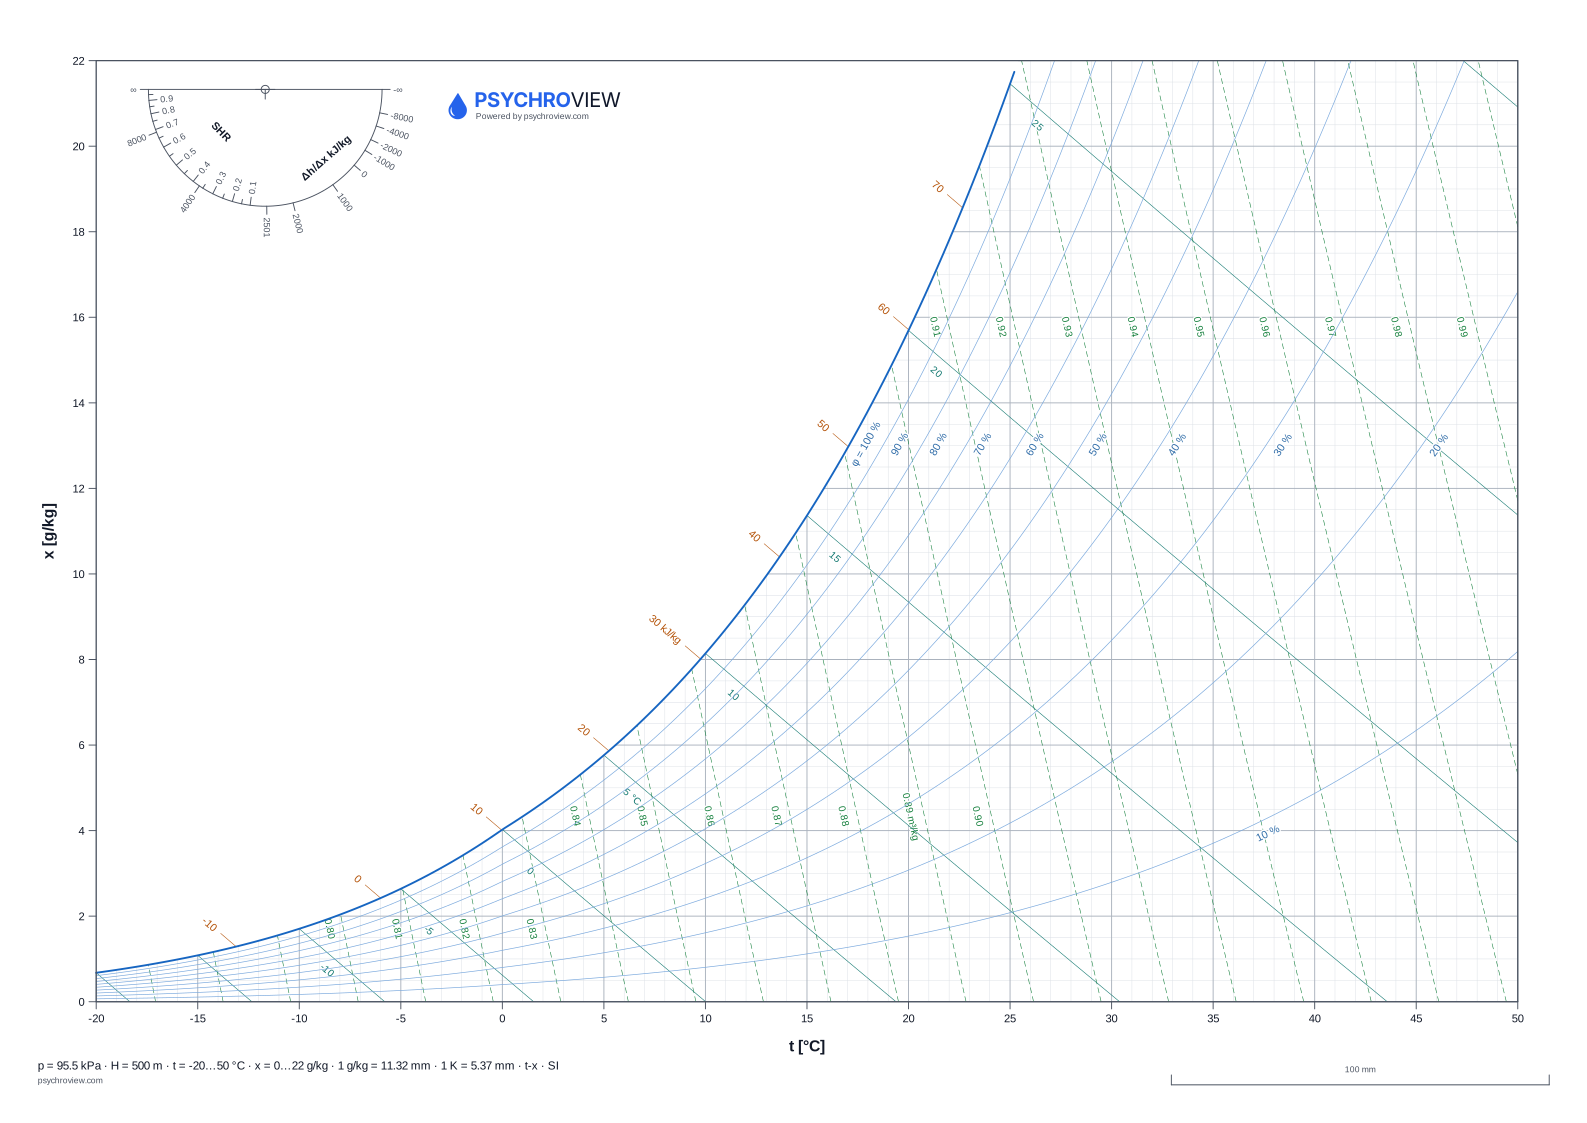
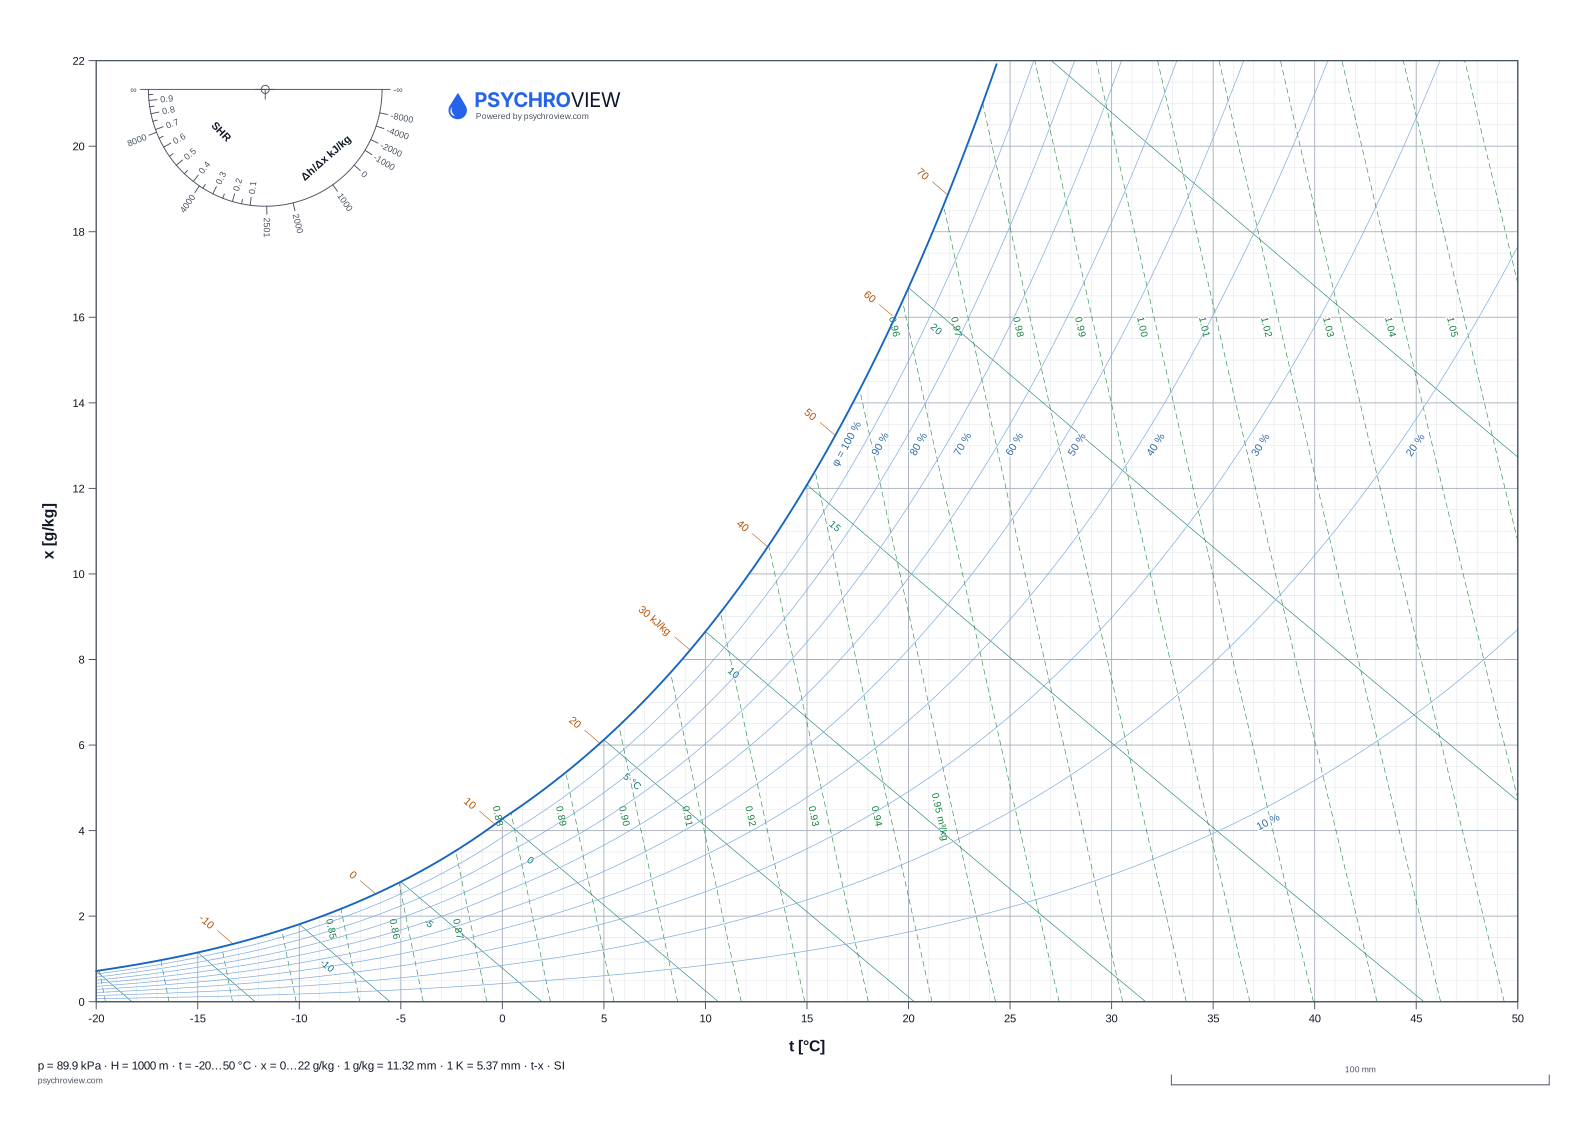
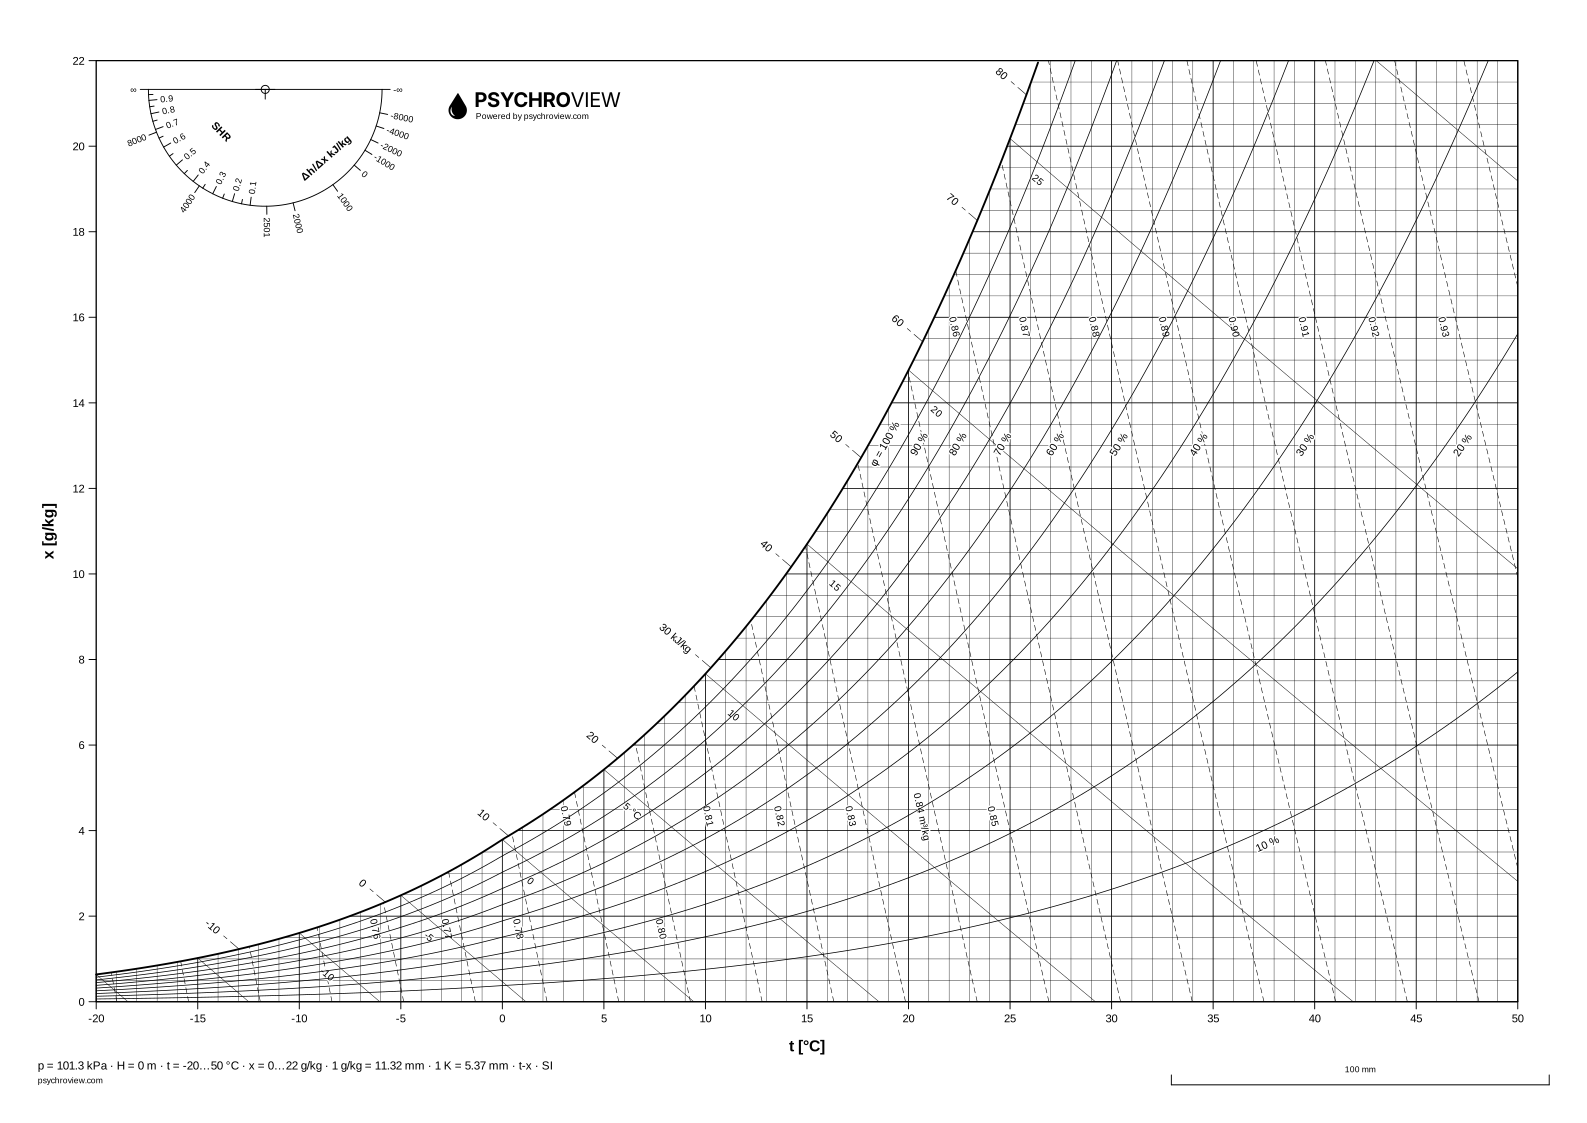
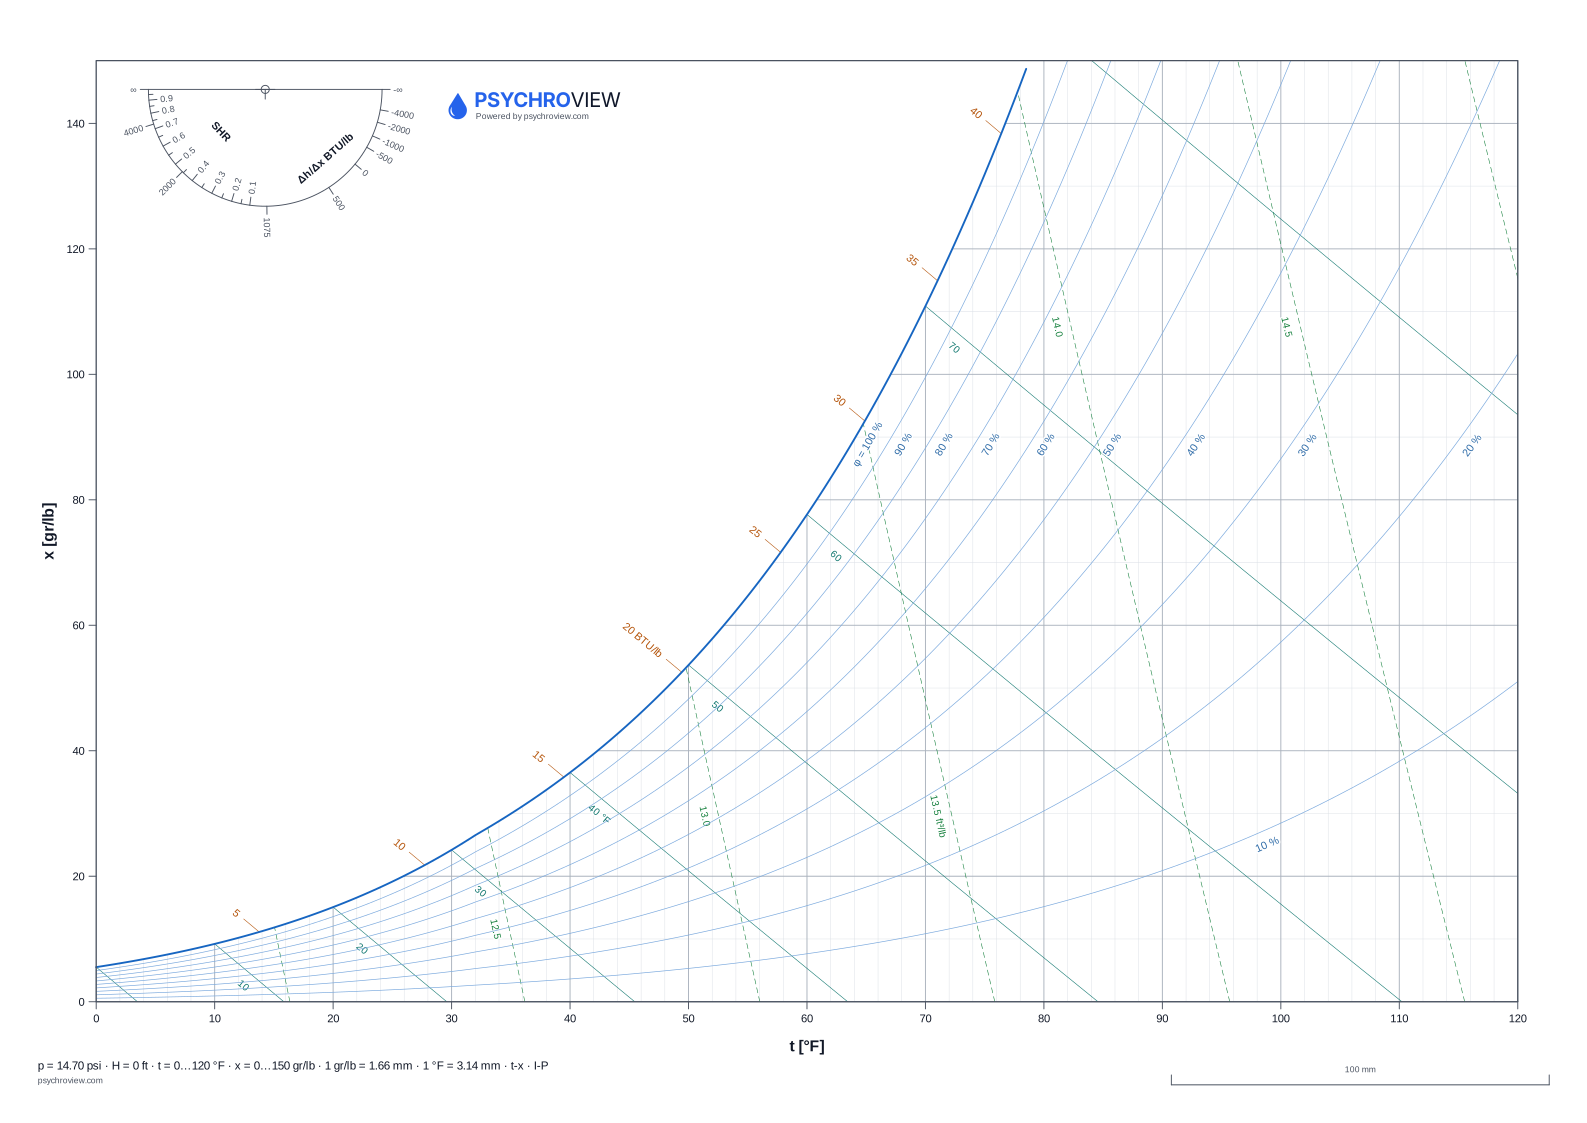
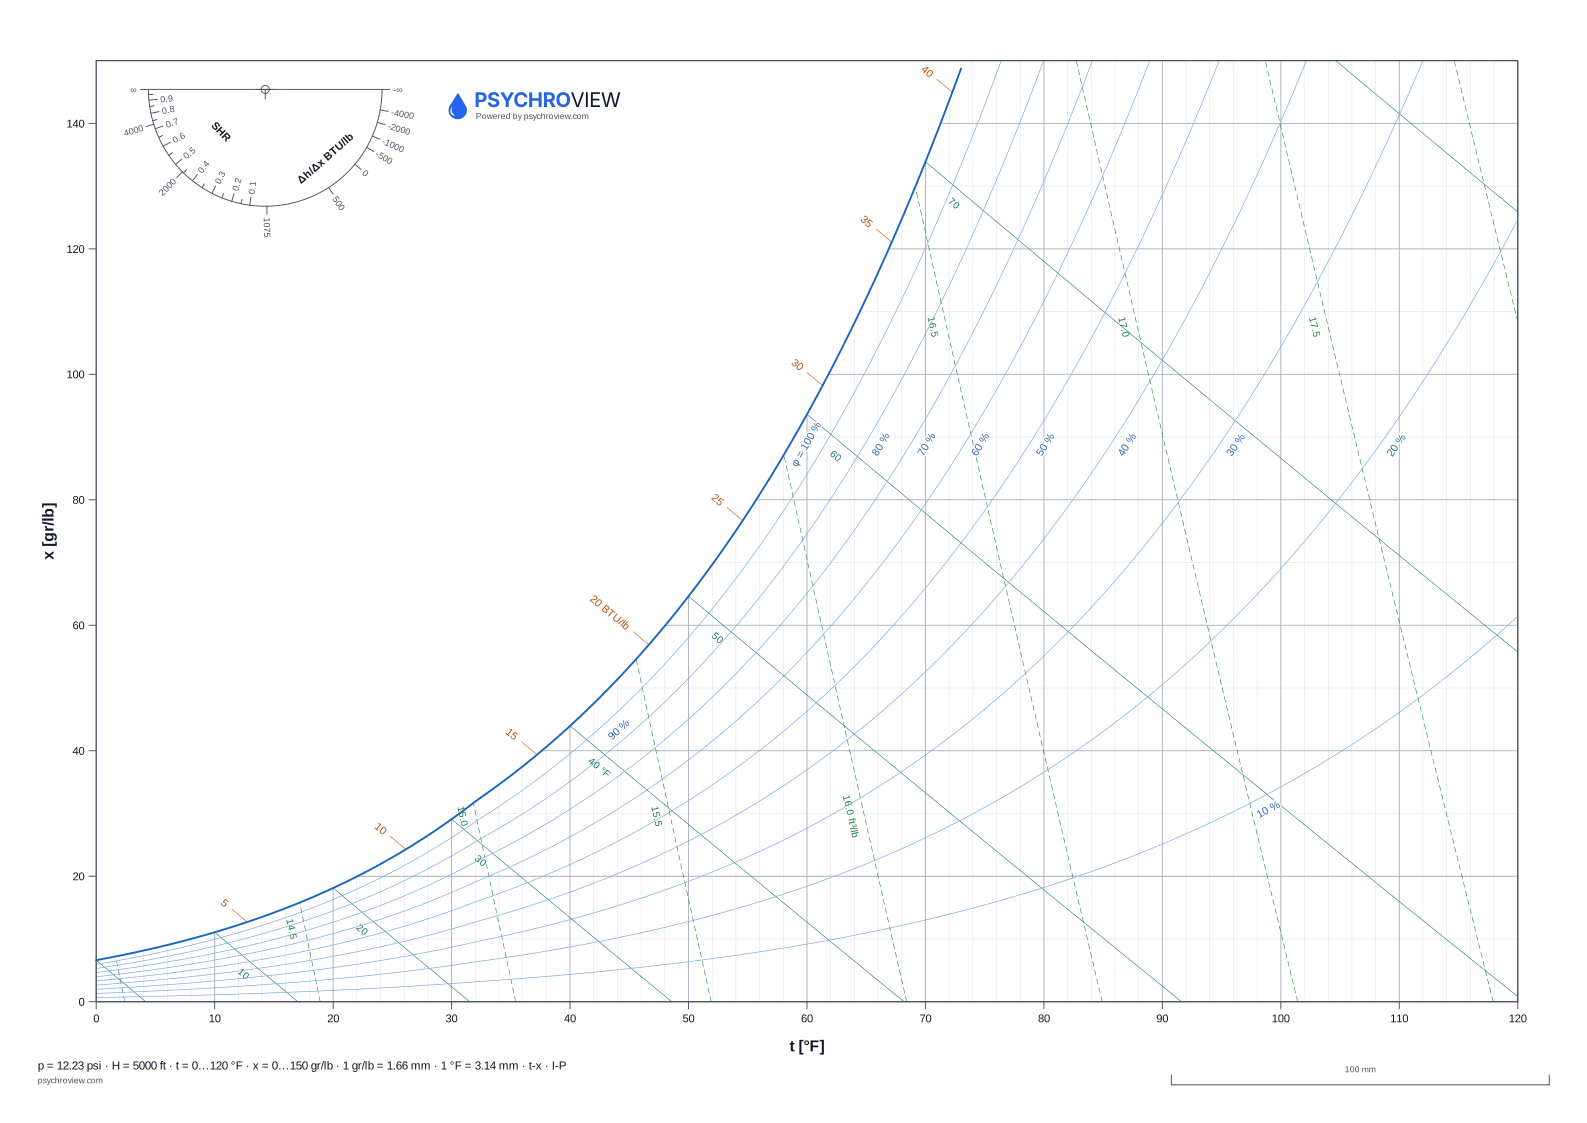
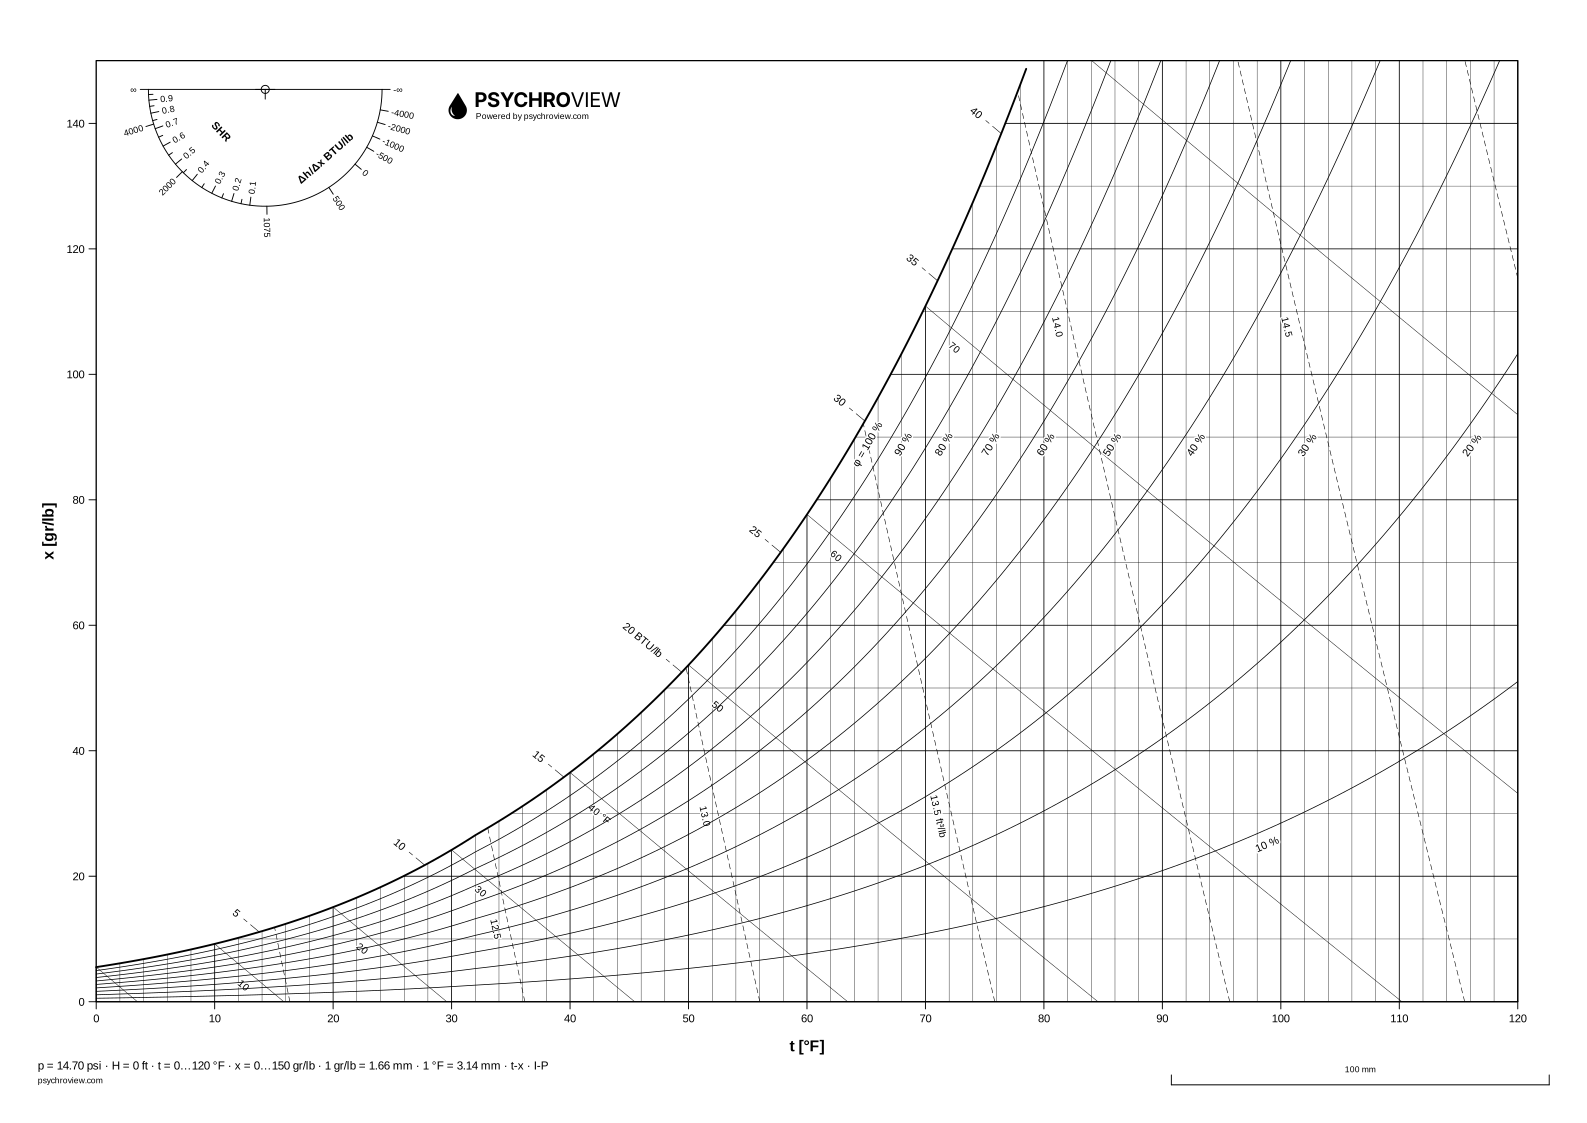
What the two axes are
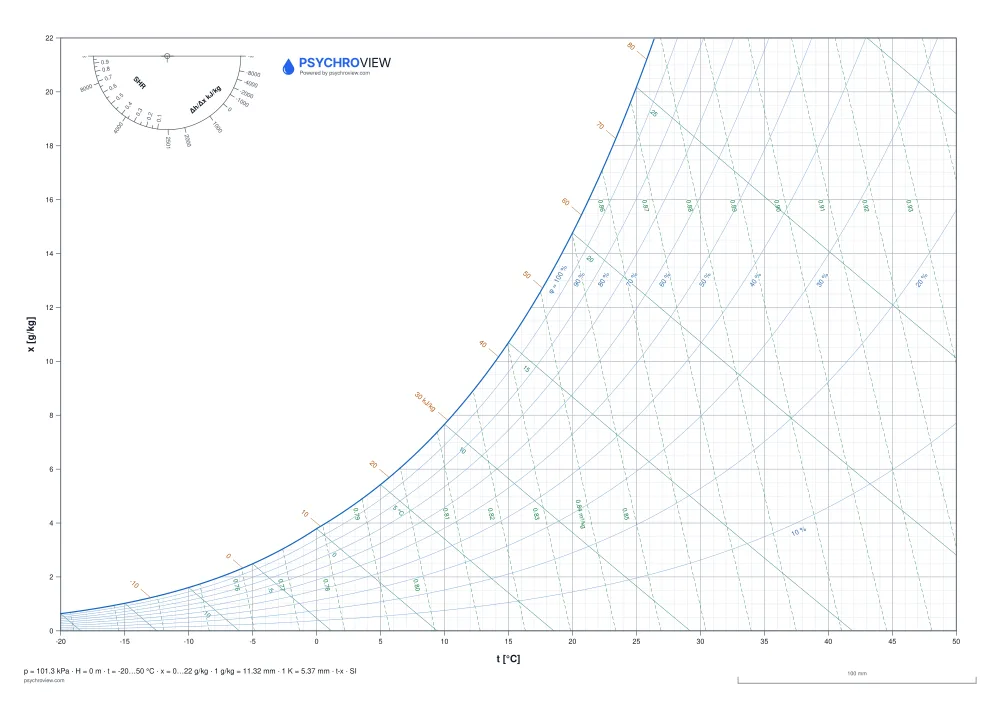
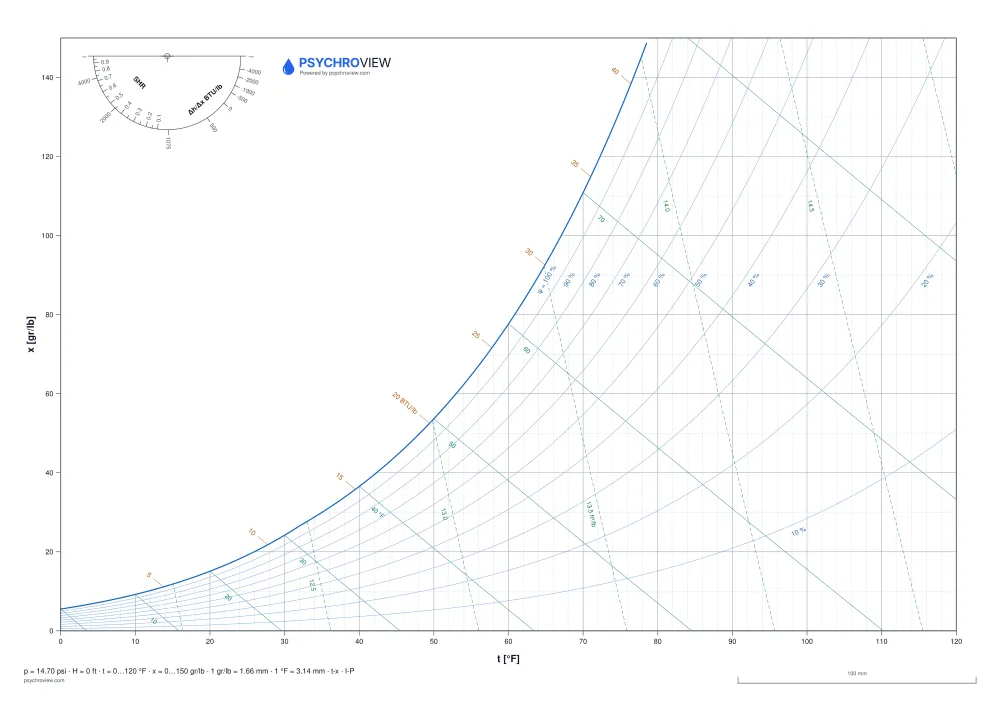
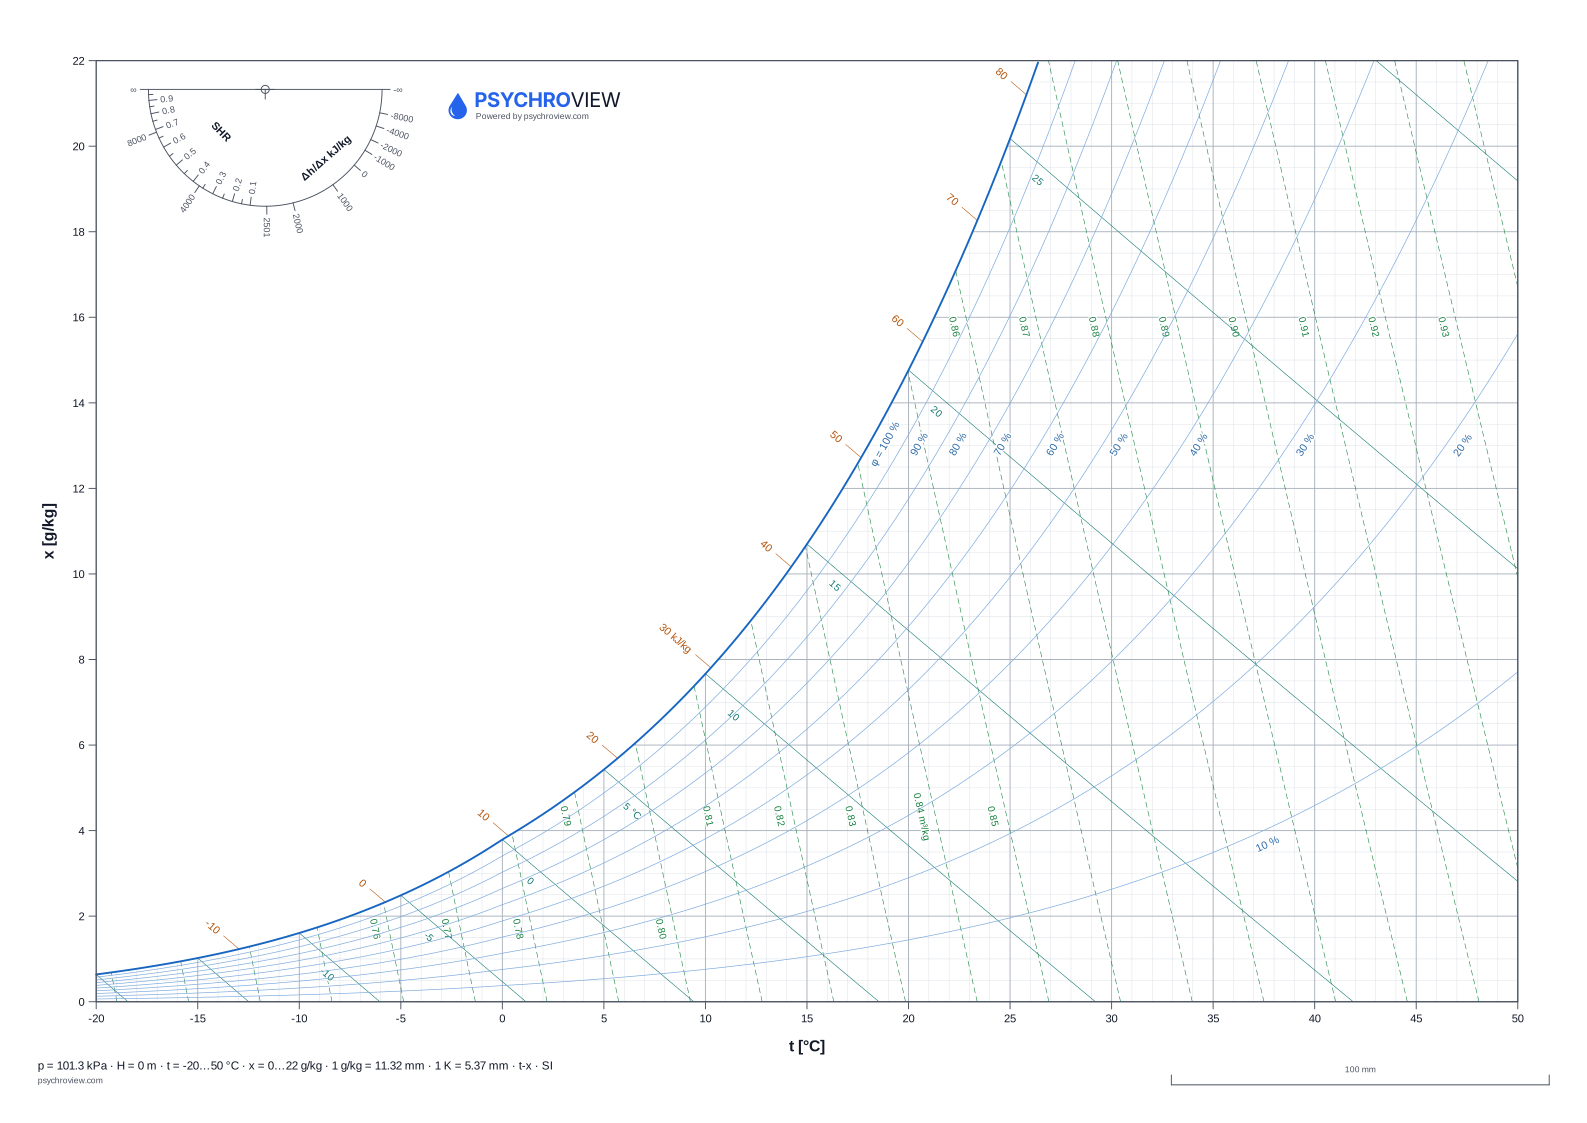
On the Carrier chart dry-bulb temperature runs along the bottom and humidity ratio up the right-hand side, in grams of water per kilogram of dry air (grains per pound in I-P). This is the ASHRAE convention and the one you will meet in North American literature and in most equipment selection software.
Enthalpy is not an axis here: isenthalps are the oblique family falling to the right, and on these sheets they double as the wet-bulb lines — see below. The saturation line closes the chart on the upper left, and the region beyond it, where no real air can be, is where the labels and the protractor live.
Wet-bulb and enthalpy are the same family
In this calculation core the wet-bulb temperature is defined adiabatically: it is the temperature at which saturated air would have the same enthalpy as your state. A line of constant tw is therefore exactly a line of constant h. Drawing both families across the whole sheet would give you doubled, partly overlapping lines that add nothing and only clutter the grid.
So each sheet draws one of them in full and reduces the other to a scale along the saturation line. On the Carrier sheets the wet-bulb family is the one drawn in full — it is the family this chart is read with — and enthalpy appears as labeled stubs. On the Mollier sheets it is the other way round.
Relative humidity, dew point and the saturation line
The heaviest line, 0.5 mm, is φ = 100 %. Relative-humidity curves follow every 10 % below it and are labeled on the curve itself, because on paper there is nowhere to look up a legend.
Dew point is a move horizontally to the left at constant humidity ratio until you reach the saturation line; read the temperature there. That horizontal move is the one clear advantage of the Carrier layout — on a Mollier sheet the same operation runs down a vertical.
SHR and the protractor
A cooling coil rarely removes only heat. The split between sensible and total load is the sensible heat ratio, and on the chart it is a direction, not a point. The half-circle in the empty region carries the SHR scale on the inside of the arc and ε = Δh/Δx (kJ or Btu per kg or lb of water) on the outside.
Find your SHR on the arc, lay a ruler through it and the center cross, then slide the ruler parallel to itself until it passes through the room state. Where that line meets the saturation line is the apparatus dew point. SHR = 1 is the straight edge of the half-circle — purely sensible, the same direction as ε = ∞ — which is why it is not printed again on the arc.
SI or I-P — and why altitude is on the sheet
The I-P sheets are labeled in °F, grains per pound and Btu per pound, with the enthalpy datum at 0 °F as ASHRAE defines it, not the 0 °C datum of the SI sheets. Do not mix numbers between the two systems; convert states, not enthalpies.
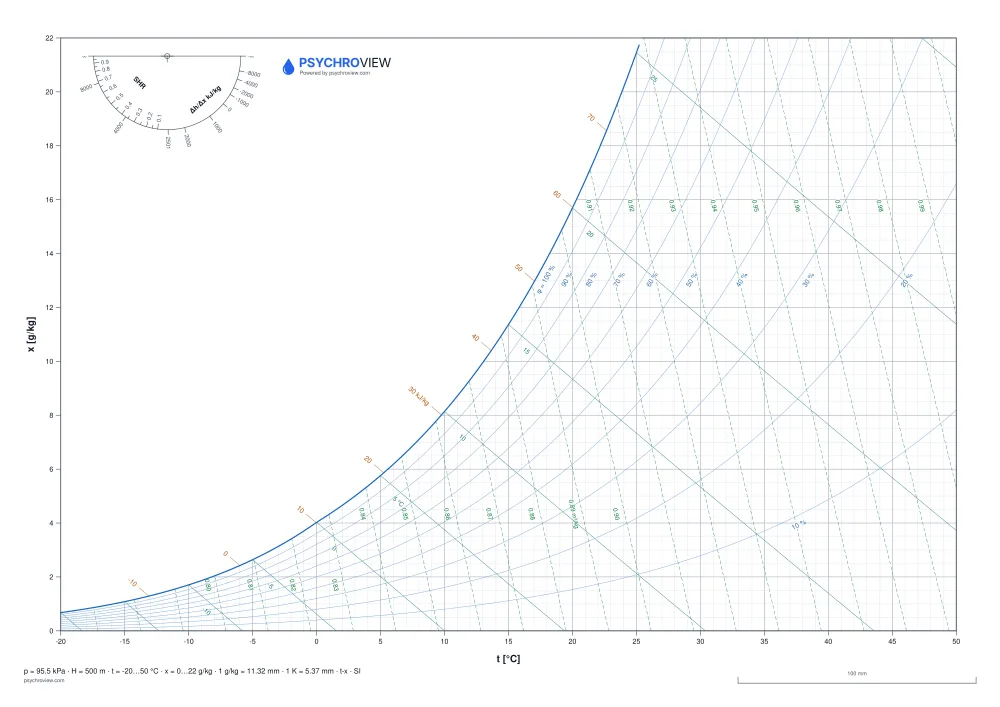
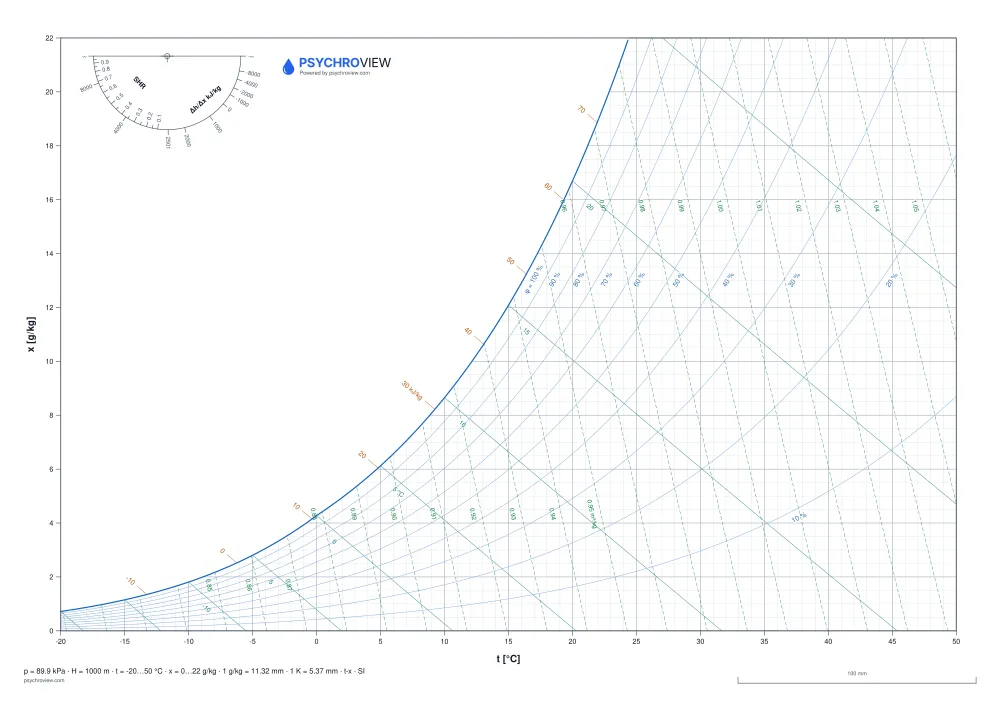
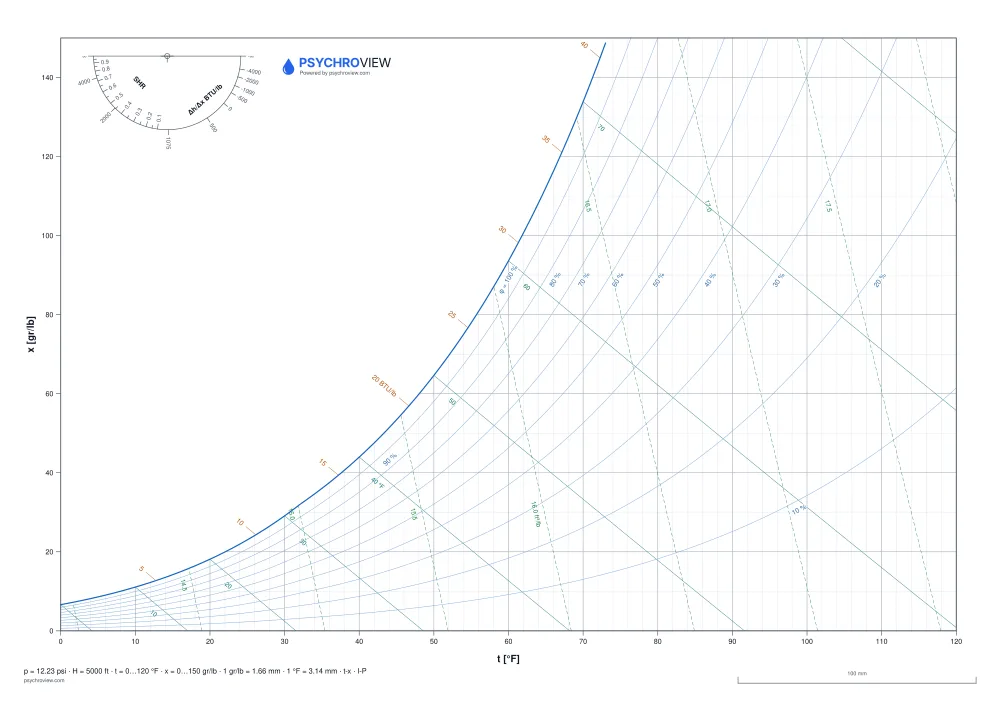
Altitude is printed because the chart is only valid at one barometric pressure. The set includes sea level and 5 000 ft (Denver) in I-P, and sea level, 500 m and 1 000 m in SI. Using a sea-level sheet in Denver puts the saturation line in the wrong place and every relative humidity you read off it is wrong with it.
Before you measure on the printout
The footer strip carries the pressure, the ranges, the scale in millimeters per unit and a 100 mm control line. Measure that line. Printer drivers shrink pages by a few percent under “fit to page”, and a chart you measure differences on has to be printed at 100 %.
Where paper ends. A blank sheet is the fastest way to check a process with a pencil — and for checking someone else’s calculation often the only sensible one. The moment one input changes, though, the whole chain has to be redrawn. That part is what the application does: the same chart, chained processes, export to PDF and DXF.
Working in CAD?
The same charts are available as DXF with named layers — insert one into your drawing, switch off what gets in the way and draw your process on your own layer.
Psychrometric chart as DXF →Frequently asked questions
Is this the ASHRAE psychrometric chart? +
It is drawn to the ASHRAE convention and computed from ASHRAE Handbook — Fundamentals 2021 relations with the Hyland-Wexler saturation equations, but it is our own drawing, not a reproduction of a chart published by ASHRAE. The comparison against the ASHRAE reference tables is published on our conformance page.
Which I-P sheet do I need for Denver? +
The 5 000 ft variant. Denver sits close to that altitude, where barometric pressure is about 84 kPa instead of 101.3 kPa. A sea-level sheet would put the saturation line several grains per pound too low.
Why are the enthalpy lines only stubs on this sheet? +
Because wet-bulb temperature is defined adiabatically here, so constant wet-bulb and constant enthalpy are the same straight lines. Drawing both in full would double every line on the chart. The Carrier sheets draw wet-bulb in full and keep enthalpy as a labeled scale along the saturation line.